
Each year the WMO (World Meteorological Organization) issues their “State of the Planet” report. Because they were founded in 1873 and represent every Meteorological Organization on the planet, all they can do is to be honest and truthful, hence they confirm that global warming is a Chinese hoax. Oh wait, that’s not what this report tells us. What this latest report does do is too yet again issue yet another strong evidence-based wake-up call.
Very Dire warmings, very strong language
“The physical signs and socio-economic impacts of climate change are accelerating as record greenhouse gas concentrations drive global temperatures towards increasingly dangerous levels“, according to this new report from the World Meteorological Organization.
Published on 28th March 2019, this is the 25th edition.
WMO Secretary-General Petteri Taalas …
Since the Statement was first published, climate science has achieved an unprecedented degree of robustness, providing authoritative evidence of global temperature increase and associated features such as accelerating sea level rise, shrinking sea ice, glacier retreat and extreme events such as heat waves
Indicators

The WMO uses the above list of seven state-of-the-climate indicators that are drawn from the 55 Global Climate Observing System (GCOS) Essential Climate Variables. Let’s take a quick pass at each of these and see what this latest report tells us.
Highlights
1 of 7 – Temperature: Surface Temperature

for the five global temperature datasets.Source: UK Met Office Hadley Centre.
The global mean temperature for 2018 is estimated to be 0.99 ± 0.13 °C above the pre- industrial baseline (1850–1900). The estimate comprises five independently maintained global temperature datasets and the range represents their spread
2 of 7 – Temperature: Ocean Heat

More than 90% of the energy trapped by GHGs goes into the oceans and ocean heat content provides a direct measure of this energy accumulation in the upper layers of the ocean. Unlike surface temperatures, where the incremental long-term increase from one year to the next is typically smaller than the year-to-year variability caused by El Niño and La Niña, ocean heat content is rising more revealed by satellite altimetry (World Climate Research Programme Global Sea Level Budget Group, 2018).
3 of 7 – Atmosphere: CO2

In 2017, GHG concentrations reached new highs, with globally averaged mole fractions of CO2 at 405.5 ± 0.1 parts per million (ppm), methane (CH4) at 1 859 ± 2 parts per billion (ppb) and nitrous oxide (N2O) at 329.9 ± 0.1 ppb (see above). These values constitute, respectively, 146%, 257% and 122% of pre-industrial levels (before 1750).
Global average figures for 2018 will not be available until late 2019, but real-time data from a number of specific locations, including Mauna Loa (Hawaii) and Cape Grim (Tasmania) indicate that levels of CO2, CH4 and N2O continued to increase in 2018.
4 of 7 – Ocean and Water: Acidification

In the past decade, the oceans have absorbed around 30% of anthropogenic CO2 emissions. Absorbed CO2 reacts with seawater and changes ocean pH. This process is known as ocean acidification. Changes in pH are linked to shifts in ocean carbonate chemistry that can affect the ability of marine organisms, such as molluscs and reef-building corals, to build and maintain shells and skeletal material. This makes it particularly important to fully characterise changes in ocean carbonate chemistry. Observations in the open ocean over the last 30 years have shown a clear trend of decreasing pH
(Side note: pH is a figure expressing the acidity or alkalinity of a solution on a logarithmic scale on which 7 is neutral, lower values are more acid and higher values more alkaline hence seeing the trend downwards on that right-hand figure is very bad news)
5 of 7 – Ocean and Water: Sea Level
It is record breaking.

Sea level is one of the seven key indicators of global climate change highlighted by GCOS and adopted by WMO for use in characterising the state of the global climate in its annual statements. Sea level continues to rise at an accelerated rate. Global mean sea level for 2018 was around 3.7 mm higher than in 2017 and the highest on record. This bit has attracted headlines.
6 of 7 – Cryosphere: Glaciers

Source: World Glacier Monitoring Service (2017, updated and earlier reports),
https:// wgms.ch/faqs/.
The World Glacier Monitoring Service monitors glacier mass balance using a set of global reference glaciers having more than 30 years of observations between 1950 and 2018. They cover 19 mountain regions. Preliminary results for 2018, based on a subset of glaciers, indicate that the hydrological year 2017/18 was the thirty-first consecutive year of negative mass balance, with a mass balance of -0.7 m water equivalent. The cumulative loss of ice since 1970 amounts to 21.1 m water equivalent.
7 of 7 – Cryosphere: Sea Ice Extent

Arctic sea-ice extent was well below average throughout 2018 and was at record low levels for the first two months of the year. The annual maximum occurred in mid- March and the March monthly extent was 14.48 million km2, approximately 7% below the 1981–2010 average.
Antarctic sea-ice extent was also well below average throughout 2018. The monthly extent in January was the second lowest, and in February the lowest. The annual minimum extent occurred in late February and the monthly average was 2.28 million km2, 33% below average and ranked record low in the C3S dataset and second lowest in the NSIDC data.
Climate Action Summit – Sep 2019
This WMO report will be their contribution to the summit taking place next Sept.
United Nations Secretary General António Guterres. …
“Climate change continues to accelerate, and reading the report, three things stand out,” said Mr Guterres.
“First, we are seeing record highs in land and ocean temperatures, sea levels and greenhouse gas concentrations.
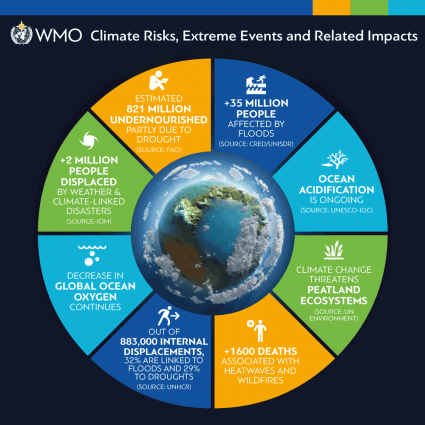
“Second, we are seeing, more and more, the dramatic impact of extreme weather conditions. Last year, in the United States alone, we saw 14 weather- and climate-related disasters where the devastation cost more than $1 billion dollars each, with a total of some US$49 billion dollars. Worldwide, more than 35 million people were affected by floods. Cyclone Idai in southern Africa is a particularly stark recent example, as it was demonstrated,” said Mr Guterres.
“Third, the impact on public health is escalating. The average number of people exposed to heatwaves has increased by some 125 million since the beginning of the century, with deadly consequences. The combination of extreme heat and air pollution is proving increasingly dangerous, especially as heatwaves will become longer, more intense and more frequent,” said the UN Secretary-General.
“So, this report is indeed another strong wake-up call. It proves what we have been saying that climate change is moving faster than our efforts to address it,” he said.
Mr Guterres said the climate action summit on 23 September would seek to inject greater ambition into the fight against climate change.
“I am telling leaders: “Don’t come with a speech; come with a plan,” he said.