
 Over at Penn State ESSC (Earth System Science Center) have issued a 2018 Hurricane forecast …
ESSC scientist Michael E. Mann, alumnus Michael Kozar, and researcher Sonya K. Miller have released their seasonal prediction for the 2018 North Atlantic hurricane season, which officially starts on June 1st and runs through November 30th.
The prediction is for 10.2 +/- 3.2 total named tropical cyclones, which corresponds to a range between 7 and 13 storms with a best estimate of 10 named storms. This prediction was made using the statistical model of Kozar et al. (2012, see PDF here). This statistical model builds upon the past work of Sabbatelli and Mann (2007, see PDF here) by considering a larger number of climate predictors and including corrections for the historical undercount of events (see footnotes).
The assumptions behind this forecast are (a) the persistence of current North Atlantic Main Development Region (MDR) sea surface temperature (SST) anomalies (0.30 °C in late-April 2018 from NOAA’s Coral Reef Watch) throughout the 2016 hurricane season, (b) mild ENSO conditions in the equatorial Pacific during boreal Fall/Winter 2018-2019 (ENSO forecasts here; we used mid-April 2018), and (c) climatological mean conditions for the North Atlantic Oscillation in Fall/Winter 2018-2019.
If no El Niño develops, then the prediction will be very slightly higher: 11.1 +/- 3.3 storms (range of 8-14 storms with a best guess of 11).
How Accurate have previous Forecasts been?
They are all usually within the right ball park.
For reference here they are …
Previous Forecasts:
|
Year (click to see forecast)
|
Prediction
|
Best Guess
|
Range
|
Actual Count
|
|---|---|---|---|---|
| 2007 | n/a | 15 | n/a | 15 |
| 2009 | 11.5 +/- 3.4 | 12 | 8-15 (6-13 if El Niño) | 9 |
| 2010 | 23.4 +/- 4.8 | 23 | 19-28 | 19 |
| 2011 | 16.25 +/- 4.0 | 16 | 12-20 | 19 |
| 2012 | 11.2 +/- 3.3 | 11 | 8-15 | 19 |
| 2013 | 16.0 +/- 4.0 | 16 | 12-20 | 14 |
| 2014 | 9.3 +/- 3.0 | 9 | 6-12 | 8 |
| 2015 | 6.9 +/- 2.6 | 7 | 4-10 | 11 |
| 2016 | 18.9 +/- 4.4 | 19 | 14-24 | 15 |
| 2017 | 15.3 +/- 3.9 | 15 | 11-20 | 17 |
Global Warming & Hurricanes
Real Climate has an article where several subject matter experts, including one of the authors of the above forecast, discuss the impact that Climate change is having on Hurricanes. To be a tad more precise, they use the more generic term Tropical Cyclone.
First the basics.
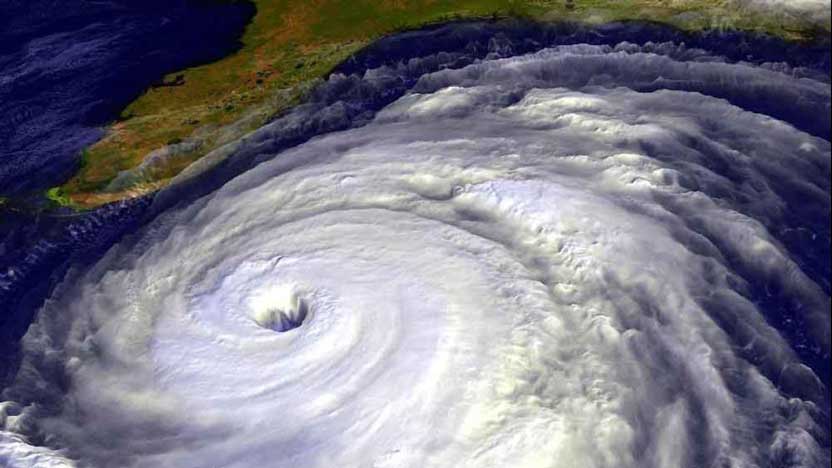
The energy source that drives a Tropical Cyclone / Hurricane is the evaporation of water over warm bodies of ocean. Water vapour rises, then condenses and falls again. Due to the conservation of angular momentum imparted by the Earth’s rotation the entire mass rotates.
Because global warming is heating things up, there was a prediction made 30 years ago that Tropical Cyclones would become more intense (emphases mine, not theirs) …
The results of numerous such studies can be summarized briefly as follows: due to global warming we do not necessarily expect more tropical storms overall, but an increasing number of particularly strong storms in categories 4 and 5, especially storms of previously unobserved strength. This assessment has been widely agreed on at least since the 4th IPCC Report of 2007 and reaffirmed several times since then. A review article in the leading journal Science (Sobel et al. 2016) concluded:
We thus expect tropical cyclone intensities to increase with warming, both on average and at the high end of the scale, so that the strongest future storms will exceed the strength of any in the past.
The question of the moment is this – what does the data reveal, is there any evidence that this is actually happening?
Here is what they reveal …
Sandy (2012) was the largest hurricane ever observed in the Atlantic. Harvey (2017) dumped more rain than any hurricane in the United States. Ophelia (2017) formed further northeast than any other Category 3 Atlantic hurricane – fortunately it turned north before striking Portugal, against initial predictions, and then weakened over cool waters before it hit Ireland. September 2017 broke the record for cumulative hurricane energy in the Atlantic. Irma (2017) sustained wind speeds of 300 km/h longer than any storm on record (for 37 hours – the previous record was 24 hours by Haiyan in 2013). Cyclone Pam in March 2015 was already beaten again by Winston in February 2016 according to the Southwest Pacific Enhanced Archive for Tropical Cyclones (though not in Velden’s data analysis). Donna in 2017 was the strongest May cyclone ever observed in the Southern Hemisphere. All coincidence?
One of us (Emanuel) performed an analysis of linear trends in historical tropical cyclone data from 1980 to 2016. These include some observations by aircraft, ships, buoys, and stations on land in addition to the satellite data, but these have not been treated for inhomogeneities.
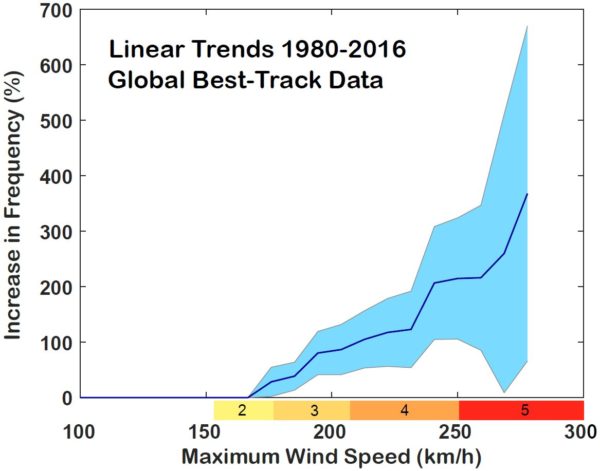
Fig. 2 Percentage increase 1980 to 2016 (as a linear trend) in the number of tropical storms worldwide depending on their strength. Only 95% significant trends are shown. The strongest storms are also increasing the most. Red colors show the hurricane category on the Saffir-Simpson scale. Graph by Kerry Emanuel, MIT. Creative Commons License CC BY-SA 3.0.
A significant global increase (95% significance level) can be found in all storms with maximum wind speeds from 175 km/h. Storms of 200 km/h and more have doubled in number, and those of 250 km/h and more have tripled. Although some of the trend may be owing to improved observation techniques, this provides some evidence that a global increase in the most intense tropical storms due to global warming is not just predicted by models but already happening.
However, global warming does not only increase the wind speed or frequency of strong storms (which is actually two ways of looking at the same phenomenon, as frequency depends on wind speed). The average location where the storms are reaching their peak intensity is also slowly migrating poleward (Kossin et al. 2014) and the area where storms occur expands (Benestad 2009, Lucas et al. 2014), which changes patterns of storm risk and increases risk in regions that are historically less threatened by these storms (Kossin et al. 2016).
Most damage caused by tropical storms is not directly caused by the wind, but by water: rain from above, storm surge from the sea. Harvey brought the largest amounts of rain in US history – the probability of such a rain event has increased several times over recent decades due to global warming (Emanuel 2017; Risser and Wehner, 2017; van Oldenborgh et al., 2017). Not least due to global warming, sea levels are rising at an accelerating rate and storm surges are becoming more dangerous. A recent study (Garner et al. 2017), for example, shows that the return period of a certain storm surge height in New York City will be reduced from 25 years today to 5 years within the next three decades. Therefore, storm surge barriers are the subject of intensive discussion in New York (Rahmstorf 2017).
The weight of the evidence is that the thirty year old prediction is indeed coming to pass.
More intense hurricanes due to global warming are not events in some far and distant future, they are here now. We are at the start of this year’s hurricane season.
This is also why some argue for the addition of a new Category 6 to the scale.
"Hurricane Season 2018: Experts Warn of Super Storms, Call For New Category 6" by @BBerwyn for @InsideClimate News: https://t.co/RNtgD6lnBU
— Michael E. Mann (@MichaelEMann) June 2, 2018