 For those living in the arctic region, there is no debate regarding the reality of climate change. Each and every year they can see the ongoing decline of sea ice. Every season marks another data point.
NSIDC Update
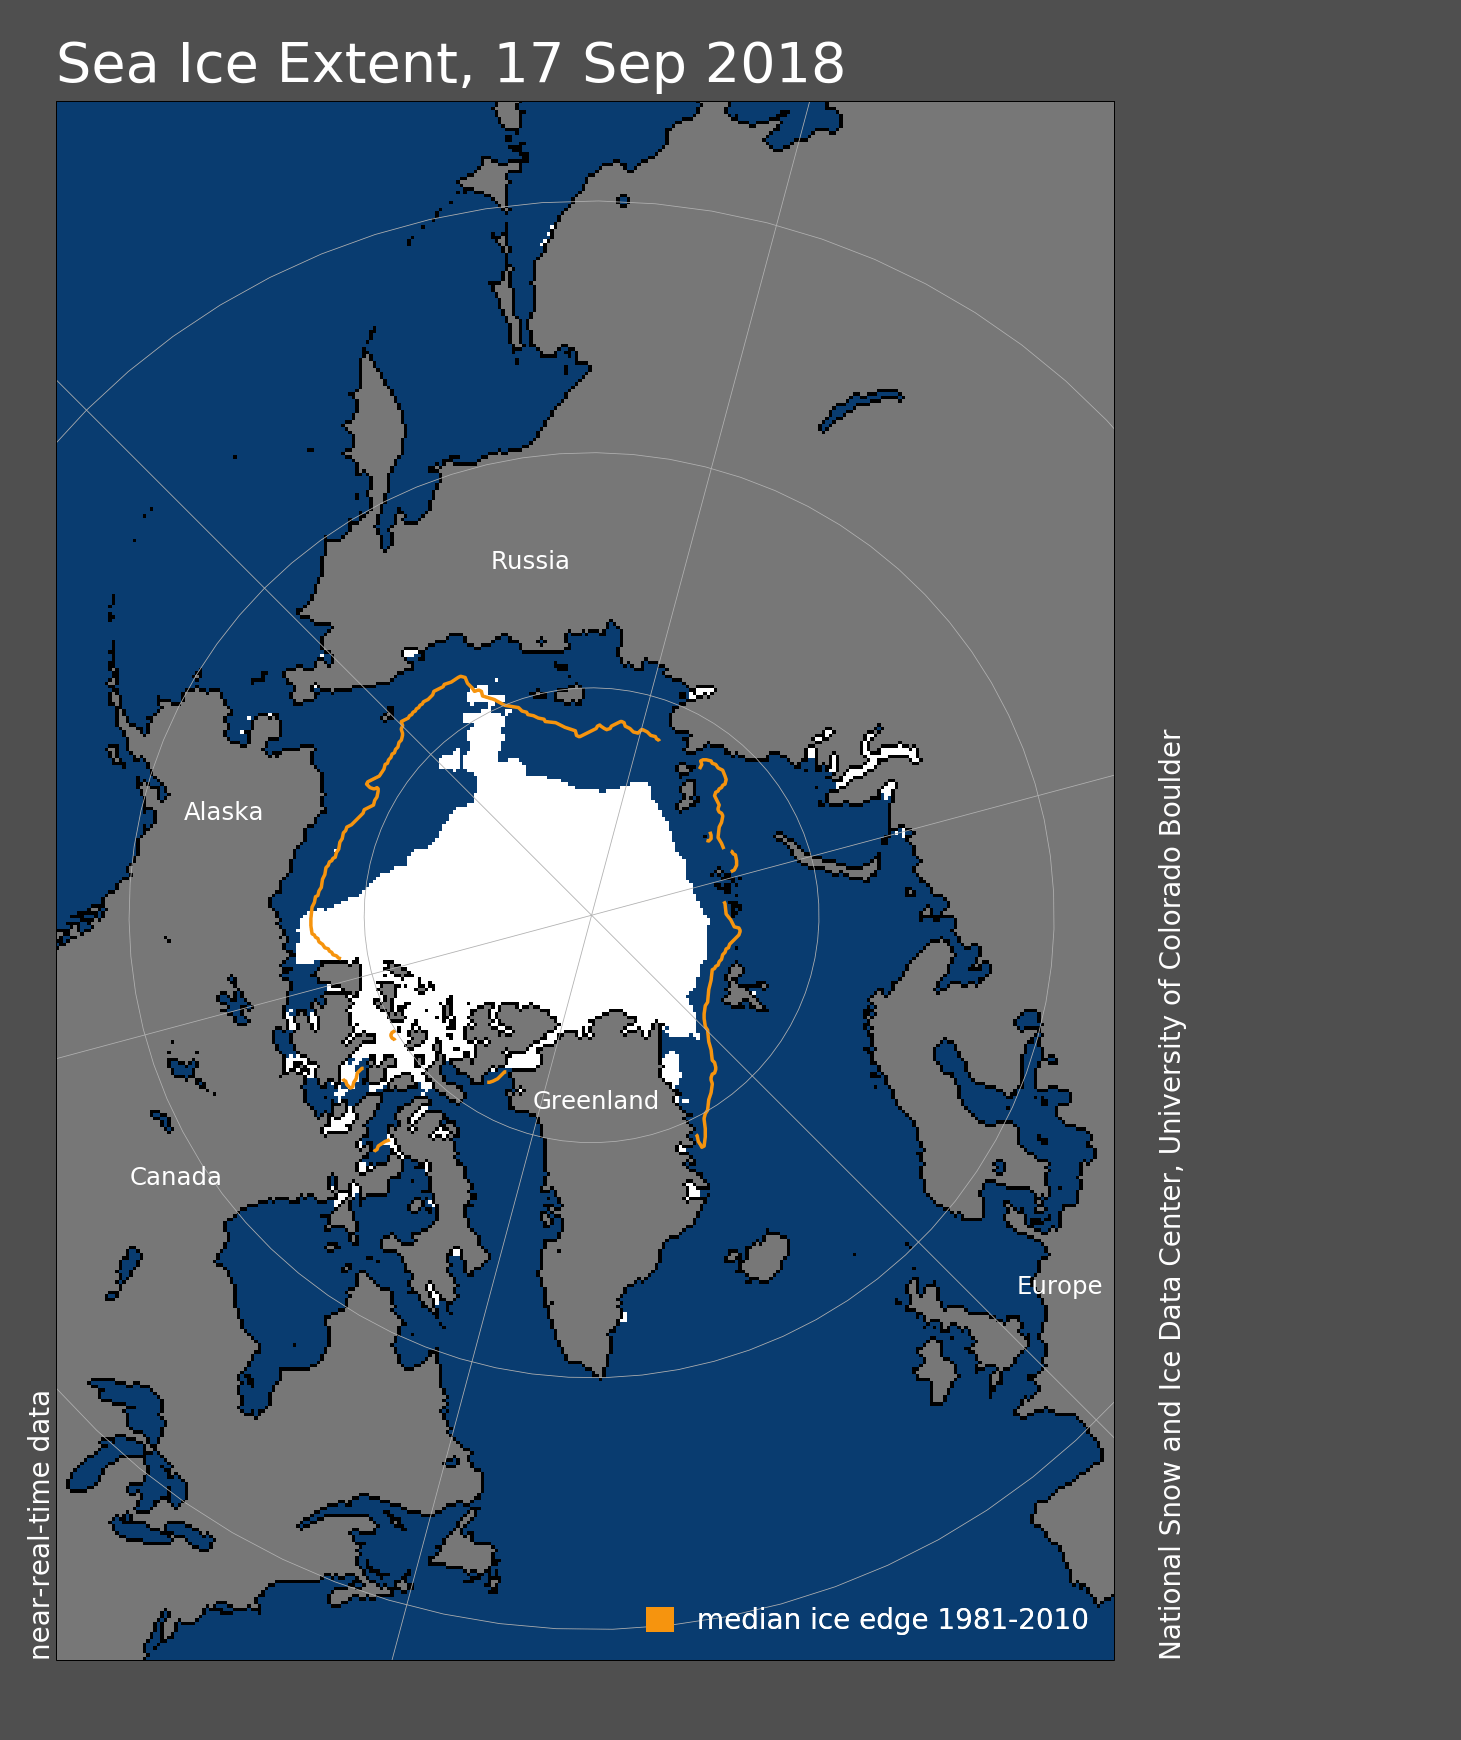
If you check out the National Snow and Ice data centre then you can find very precise measurements collected via satellite. This grants us a view of the entire arctic and also a yields trend lines over the years. Their latest update (dated 19th Sept) is this …
On September 17, Arctic sea ice extent stood at 4.60 million square kilometers (1.78 million square miles). This was 1.69 million square kilometers (653,000 square miles) below the 1981 to 2010 long-term average extent for this day of year, but 1.21 million square kilometers (467,000 square miles) above the record low for this day of year set in 2012. With the onset of autumn, air temperatures are dropping across the Arctic. The seasonal minimum extent is imminent. The Arctic’s minimum sea ice extent is likely to be the 6th lowest in the 39-year satellite record.
Northern Sea Route
The Northern Sea Route appears to be navigable … you can see that …
Study: Changing state of Arctic sea ice across all seasons
Subject matter experts from UCL, NSIDC, and the Max Planck Institute for Meteorology have published a new study.
Highlights:
Climate Change is not simply a seasonal summer event, it is impacting the arctic for the duration of the entire seasonal cycle.
They find that relative to the 1981–2010 reference period, recent anomalies in spring and winter sea ice coverage have been more significant than any observed drop in summer sea ice extent throughout the satellite period. For example, the sea ice extent in May and November 2016 was almost four standard deviations below the reference sea ice extent in these months. Decadal ice loss during winter months has accelerated from −2.4 %/decade from 1979 to 1999 to −3.4%/decade from 2000 onwards.
They also looked at regional ice loss and found that for any given region, the seasonal ice loss is larger the closer that region is to the seasonal outer edge of the ice cover.
They also make it very clear that this is not part of a normal cycle, we are doing this. Across all months, they identify a robust linear relationship between pan-Arctic sea ice extent and total anthropogenic CO2 emissions. The annual cycle of Arctic sea ice loss per ton of CO2 emissions ranges from slightly above 1 m2 throughout winter to more than 3 m2 throughout summer.
With such a clear relationship between CO2 emissions and sea ice, they can advise on exactly how much more CO2 will lead to total Arctic sea ice loss. They find that the Arctic Ocean will become sea-ice free throughout August and September for an additional 800 ± 300 Gt of CO2 emissions, while it becomes ice free from July to October for an additional 1400 ± 300 Gt of CO2emissions.
Why should we care, it is all far away?
Sea ice plays a critical role in the Earth’s climate by regulating the exchanges of heat, momentum and moisture between the atmosphere and the polar oceans, and by redistributing salt within the ocean.
Because of its high reflectivity, sea ice reflects the majority of the sun’s radiation reaching the surface back to space, which efficiently cools the polar regions of our planet. As sea ice melts at its surface, its surface albedo is lowered, which in turn increases the amount of the sun’s energy absorbed by the ice surface and further enhances ice melt. When the ice completely melts, this solar radiation is absorbed by the darker ocean surface, generating a positive feedback that amplifies Arctic air temperatures in autumn and winter as the ocean returns the heat gained in summer back to the atmosphere. This positive feedback process is one of the reasons why the polar regions react far more strongly to a rise in global mean temperature than most other parts of our planet, and it is part of the explanation for why the Arctic has warmed faster than the rest of the globe during the last few decades.
Impact: Arctic warming may trigger concurrent processes that can be felt not only by Arctic communities, but in communities around the world through its potential influence on large-scale weather patterns
Monthly Anomalies
The following table shows the anomalies in monthly sea-ice extent from November 1978 through July 2018. The colors indicate how many standard deviations sea-ice extent in a given month was above or below the mean sea-ice extent of the reference period 1981–2010.
Key Updates from the Study
- With respect to the 1981–2010 reference period, relative ice loss has been more significant during autumn, winter and spring the last two years than during summer.
- The ice cover has not only retreated in its a real extent, it has also become much younger and thinner in recent years. In April 2018, only about 2% of the winter sea-ice cover consisted of sea ice older than 5 years, compared to almost 30% of the April sea-ice cover in 1984.
- The thinning of the ice cover and the overall warming of the Arctic have increased the likelihood of rapid ice-loss events during summer in recent years. On the other hand, the larger expanses of open water have similarly increased the likelihood of rapid ice-growth events during autumn.
- The increasing relative loss of winter sea ice is in part related to the fact that more and more regions of the Arctic Ocean completely lose their sea-ice cover during summer. This limits the potential for a further acceleration of summer sea ice loss, and causes accelerating sea ice loss during winter.
- Accelerated sea ice loss during all months of the year is additionally driven by a lengthening of the melt season. As assessed for the Arctic as a whole through April 2018, melt onset is occurring 3 days earlier per decade, and freeze-up is happening 7 days later per decade. Over the 40 year long satellite record, this amounts to a 12 day earlier melt onset and a 28 day later freeze-up.
- The recent winter sea ice loss is driven by increased inflow of warm air from the south and an overall warming of the Arctic, which both have substantially reduced the number of freezing degree days in recent years.
- The primary cause of the ongoing changes in all months are anthropogenic CO2 emissions, with a clear linear relationship between sea ice loss and cumulative anthropogenic CO2 emissions in all months. The sensitivity ranges from an ice loss per ton of anthropogenic CO2 emissions of slightly above 1 m2 during winter, to more than 3 m2 throughout summer.
That last one means we can calculate when the Arctic will be ice free.
To get to an ice free August and September we simply need to add roughly an additional 800 ± 300 Gt.
Our current rate of emissions is 40 Gt CO2 per year … I’ll leave you to do the maths on the last bit.
Tweets
Arctic sea ice reached its annual minimum extent on Sept. 19, and then again on Sept. 23, 2018. @NASA_ICE & @NSIDC watched as the ice shrunk to 1.77 million square miles on both dates, tied with 2008 & 2010 for the sixth lowest sea ice minimum on record. https://t.co/oTntz8qrBT pic.twitter.com/LihZLbM5Os
— NASA Earth (@NASAEarth) September 27, 2018