Joshua Willis, an oceanographer at NASA’s Jet Propulsion Laboratory, came up the “OMG” acronym to describe the five-year mission to study the melting of Greenland by the surrounding oceans. It stands for “Oceans Melting Greenland”, and yes, least you doubt, it is quite real, OMG is their official mission acronym. It is not just descriptive, but also wholly appropriate.
If all the ice in Greenland melted then sea level will rise by 7.34 meters (24 feet), and so understanding what is happening and how fast that melt will be is of vital importance. Back in 2013 the Intergovernmental Panel on Climate Change estimated that by about 2100 the Greenland melt would contribute about 21 centimetres to sea level rise. However, in 2015 data emerged that suggested that this was wrong, hence it became rather important to find out what was really going to happen.
Motivation for OMG
The OMG is an initiative that was officially launched back in August of 2015. MSNBC reported it at the time as follows …
Late last month, an alarming new study concluded that the glaciers of Greenland and Antarctica will melt ten times faster than previous estimates, raising ocean levels 10 feet in as little as a half century. But is it accurate? NASA has launched an urgent, five-year, $30 million study that will help scientists find out.
The official “mission,” known as Oceans Melting Greenland—yes, this is operation OMG—is designed to help scientists determine the melt-rate with unprecedented accuracy. “I barely got that name by the censors,” admits Joshua Willis, an oceanographer at NASA’s Jet Propulsion Laboratory and the project’s principal investigator. “But OMG is kind of the perfect expression for this line of research.”
In other words, the question being asked in this – will we see 5 feet of sea level rise this century or more?
We really do need to know.
What exactly has the OMG Mission been doing to answer that?
The official NASA website explains it as follows …
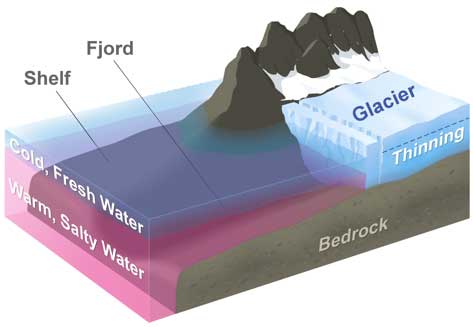
The diagram above represents a typical glacier in Greenland. Below the cold, fresh layer near the surface a layer of warm, salty water reaches into the fjords to melt the glacier’s edge. OMG will measure the volume and extent of this warm layer each year and relate it to thinning and retreat of the glaciers.
OMG will use NASA’s G-III to fly the Glacier and Ice Surface Topography Interferometer (GLISTIN-A) in order to generate high resolution, high precision elevation measurements of Greenland’s coastal glaciers during the spring. Annual surveys by GLISTIN will measure glacier thinning and retreat over the preceding season. A second aircraft campaign, also on the NASA G-III, will be occur each year in the summer to deploy 250 expendable temperature and salinity probes along the continental shelf to measure the volume, extent, of warm, salty Atlantic Water. These data, along with fundamental new and critical observations of airborne marine gravity and ship-based observations of the sea floor geometry will provide a revolutionary data set for modeling ocean/ice interactions and lead to improved estimates of global sea level rise.
This is not simply a study of one specific glacier, but instead is a fully comprehensive study that spans the entire coast right around Greenland using all available tools … ships, planes, air dropped probes, etc…
“We’ve never observed Greenland disappearing before, and that’s what OMG is about, we want to watch how it shrinks over the next five years, and see how we can use that information to better predict the future.”
– Josh Willis, principal investigator on the mission at NASA’s Jet Propulsion Laboratory
Their approach is as follows:
- Observe the year-to-year changes in the temperature, volume, and extent of warm, salty Atlantic Water on the continental shelf.
- Observe the year-to-year changes in the extent and height of all marine-terminating glaciers.
- Observe submarine topography (bathymetry) to reveal the complex network of underwater troughs and canyons connecting glacial fjords with the continental shelf.
- Investigate the relationship between the observed variations in Atlantic Water properties and glacier extent and height.
Two years in now and early results are available
There are two new studies that have been published within “Oceanography”. It is all very preliminary and so far there are no solid conclusions on what might happen yet. Instead these both yield a greater understanding of the mechanisms in play. Let’s look briefly at each in turn.
Study 1 – Improving Bed Topography Mapping of Greenland Glaciers Using NASA’s Oceans Melting Greenland (OMG) Data
To be able to run computer models that yield meaningful and accurate results we need precise numbers for the existing bed depth and ice thickness across the ice-ocean boundary around Greenland. This new study now provides that data for the Northwest Greenland coast …
Using a mass conservation approach, we combine OMG bathymetry with observations of ice velocity and thickness to produce estimates of bed depth and ice thickness across the ice-ocean boundary with unprecedented accuracy and reliability. Our results along the northwest coast of Greenland reveal complex structural features in bed elevation, such as valleys, ridges, bumps, and hollows. These features have important implications for both channeling ice flow toward the continental margin, and for controlling the amount of warm, salty Atlantic Water that reaches the glaciers.
This new map, together with OMG temperature and salinity data from CTDs, opens the door to modeling ocean circulation in the entire fjord system in three dimensions, making it possible to better understand the vertical structure of ocean waters and its temporal variability. Ultimately, these new maps will make projections of the ice sheet contribution to sea level rise over the next centuries more reliable.
Study 2 – Early Results from NASA’s Ocean-Ice Mission in Greenland
The OMG mission is guided by the over-arching science question: To what extent is the ocean melting Greenland’s glaciers from below? Within this early results paper there is a great deal of detailed information, and so it can perhaps be best summed up as follows using their own words …
Our preliminary ocean and bathymetry data provide important clues about how Atlantic Water changes as it moves north along Greenland’s west coast and reveal which glaciers terminate in deep water and are thus susceptible to Atlantic Water warming.
Beyond just that, what they have also done is to establish a baseline. When they then return and make measurements between now and 2020, then they will be able to measure what has actually changed, and thus how great the degree of on-going change actually is …
Data from our first GLISTIN campaign establish a baseline against which future changes in glacier volume will be computed for the vast majority of marine-terminating glaciers in Greenland.
Each year between now and 2020, OMG will observe changes in ice elevation for nearly all of Greenland’s marine-terminating glaciers as well as changes in the hydrographic properties of Atlantic Water on the shelf. rough careful analysis of these data in conjunction with improved maps of sea-floor bathymetry and results from high-resolution ocean model simulations, the OMG mission will provide new insights into the expected impact of future ocean-ice interactions on Greenland Ice Sheet mass loss.
The Raw data will also be freely available
All data collected through the OMG mission will be made freely available immediately after quality control and initial processing on the OMG website, https://omg.jpl.nasa.gov/portal.
Back to that key question driving OMG
Will we see 5 feet of sea level rise this century … or more?
Answering that question is of vital importance, and we need to know asap. OMG is enabling this question to be addressed. What we now know should greatly worry us, but right now there are no definitive answers … yet.
Once the data set is rich enough, it then becomes possible to feed all the data into a model and look ahead to 2100 to see what will actually happen, but not yet …
“It’s too early” to run the model, said Mathieu Morlighem, a researcher at the University of California, Irvine and the lead author of one of the papers presenting the accumulating data. “I think you need to wait another year or two, maybe more. It was not possible at all before OMG.”
What is now rather clear is that there are mechanisms in place that may indeed lead to a far faster melt than that anticipated by the 2013 IPCC report.
“These kinds of results suggest that we could be in for more sea level rise than we thought, And we’re not alone; the fact is that almost every time some new results come out of Greenland or Antarctica, we find these glaciers are more vulnerable than we thought.”
– Josh Willis, principal investigator on the mission at NASA’s Jet Propulsion Laboratory
Further Reading
- 10th Feb : Chris Mooney covers this story within The Washington Post – NASA launched an unprecedented study of Greenland’s melting. Now, the data are coming in …
“We’ve never observed Greenland disappearing before, and that’s what OMG is about,” says Josh Willis, a researcher at NASA’s Jet Propulsion Laboratory who is the principal investigator on the mission. “We want to watch how it shrinks over the next five years, and see how we can use that information to better predict the future.”
- 9th Feb : NASA announcement – NASA, UCI Reveal New Details of Greenland Ice Loss …
Less than a year after the first research flight kicked off NASA’s Oceans Melting Greenland campaign last March, data from the new program are providing a dramatic increase in knowledge of how Greenland’s ice sheet is melting from below. Two new research papers in the journal Oceanography use OMG observations to document how meltwater and ocean currents are interacting along Greenland’s west coast and to improve seafloor maps used to predict future melting and subsequent sea level rise.
- 1st Feb : Glaciers on the edge …
“This year we’re gonna bring it!” Oceans Melting Greenland (OMG) Principal Investigator Josh Willis told me excitedly. “It’s the beginning of year two of this five-year airborne mission, which means that by comparing data from the first and second years, we’ll be able to observe changes in Greenland’s glaciers and coastal ocean water for the first time.” Glaciers around Greenland’s jagged coastline have been melting into the ocean and causing increased sea level rise, so measuring the amount of ice mass loss will help us understand the impact of these changes, Willis said. “Will we see 5 feet of sea level rise this century … or more?”