There are a couple of items to cover within this posting, but first, I just can’t resist briefly commenting upon one utterly weird development that has happened in the last few months. We now have an electric car CEO literally mocking the half of the population that actually understands that climate change is real. So yea, you know who I mean, I don’t even need to name him, nor rake over the details of that car crash.
Inevitably, his EV car stock has tanked because many of his customers thought he actually cared about being green but now realise that he cares only about his ego, and being right-wing.
However, this posting is really not about him, so let’s move on.
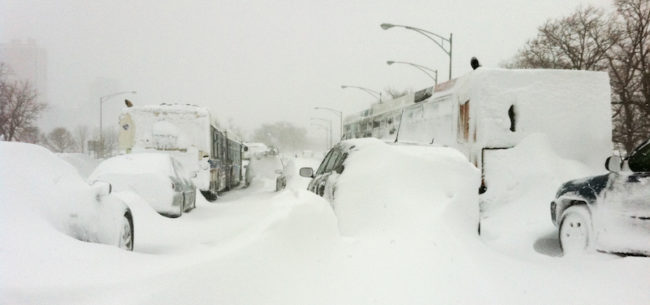
Given the current big freeze, let’s briefly cover that first before we get into my three items.
The Big Freeze is not “Evidence” that refutes Climate Change
So let’s make this very very clear. Even with the big freeze in the US, Climate Change is still very very real …
Yes it is cold, very cold, in the US. But across the globe, overall, it is actually warmer.
If indeed the climate was stable and static, with a few hot days balanced out by a few cold days, then one easy prediction is that sea level should also remain the same.
It’s not.
Sea level was, for thousands of years, static, but now it is not only rising, it is rising at an accelerated rate. That is only possible in a world that is warming …
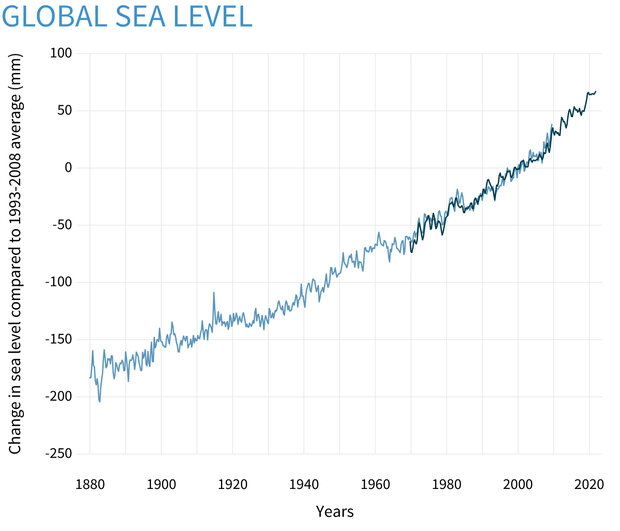
The Greenhouse gases in our atmosphere are trapping more of the energy from the sun. A great deal of this is then absorbed by the ocean, hence you not only get ice melting, but the water itself is expanding. Heat up water and the molecules move further apart and expand. Almost 90% of the extra energy we now get is absorbed by the oceans …

OK, so I promised some new climate insights. Let’s now dive into that.
New Insight 1: Big Jump in Methane
Published in Nature on Dec 14, 2022 is a new Open Access paper that explains why there has been a huge growth is Methane. Titled “Wetland emission and atmospheric sink changes explain methane growth in 2020“.
The question of concern behind this paper has been the exceptionally high rate of Methane measurements.
You can check out the latest actual measurements yourself, by going here to NOAA and using their raw data to generate the latest chart.
On that page …
- Select “Carbon Cycle Gases”
- Then “Time Series”
- Set the Parameter to “Methane”. You can leave the other settings as they are. Just click “Submit” and give it a min or two.
You will get this graphical representation of actual measurements …
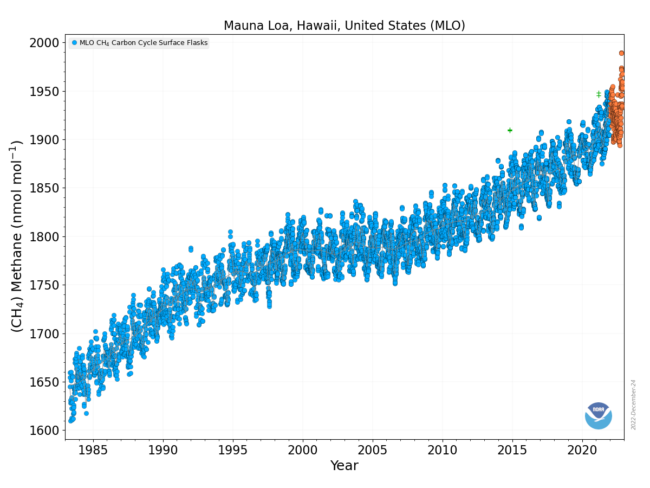
So yes, the correct response is indeed your favourite expletive.
What is going on, why this rapid uptick in Methane?
For a bit of context, we know about decreases …
- Human generated Methane has decreased by 1.2 ± 0.1 teragrams of methane per year
- Fire emissions decreased by 6.5 ± 0.1 Tg CH4 yr−1
So where is it coming from?
Well yes, the title of the paper is the spoiler.
It is the wetlands …
wetland methane emissions are sensitive to a warmer and wetter climate and could act as a positive feedback mechanism in the future
This insight is a big deal. The volume of methane is tiny when compared to the volume of CO2. Unfortunately Methane is a highly potent greenhouse gas, 80 time more potent than CO2, hence the tiny amount of it is responsible for about 15-35% of the warming.
Yikes.
Insight 2: Rate of Greenland melt
We thought we understood the rate at which Greenland was melting.
There have been models of course. Take the models used to calculate the melt rate for the floating glaciers in the Antarctic and just apply them to Greenland. Job done. Easy.
There has however been a dawning realisation that the melt rate derived from such models is wrong. It is too low.
It has been very hard to get close to the glacier fronts in Greenland because they are at the end of long narrow fjords with steep cliffs. To illustrate that here is a picture I recently took …
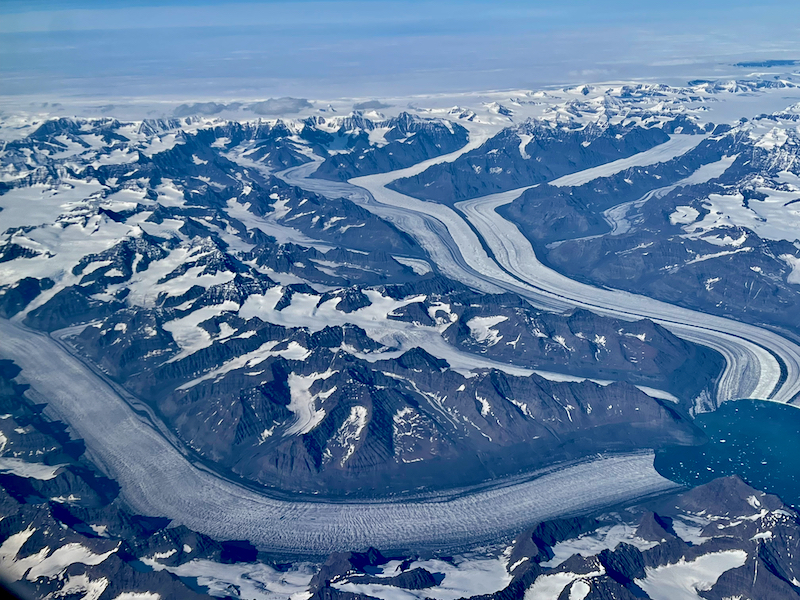
What is going on here is that warm water is undercutting the ice. This results in very dramatic calving. That’s a problem if you want to get close in a boat and gather data. The risk involved in doing that is literally life threatening.
The newer solution is the use of robotic boats. They initially experimented with this on a Glacier in Alaska.
With actual measurements and also model improvements it then becomes possible to get a far more accurate melt rate.
Published on Sep 2022 is the paper titled “An Improved and Observationally-Constrained Melt Rate Parameterization for Vertical Ice Fronts of Marine Terminating Glaciers“.
Well yes, the title explains it. To put it all into plain english …
Where Greenland’s glaciers terminate in the ocean, the relatively warm waters in the fjords melt the ice. This is a very important process, as the rate of melt determines how fast the glaciers are losing mass and inject freshwater into the ocean, which contributes to sea level rise and can change ocean currents.
Unfortunately, it is still difficult to calculate how much glacial ice is melted by the warm ocean around Greenland, as it is unfeasible to measure the small melting processes so close to the calving glacier front. Up to now, melt rate calculations rely on estimates for floating glacier tongues in Antarctica, which are more accessible, but it has become increasingly apparent that important differences exist for these two cases.
In this study, we try to find a better way to calculate melt rates for marine terminating glaciers with vertical fronts, by reconsidering the underlying physics of submarine melt, and by using observations of submarine melt waters near a vertical glacier front in Alaska.
What is now becoming increasingly clearer is that Greenland’s glaciers are melting at a far faster rate than was previously appreciated.
Understanding what is going on matters – locked up in Greenland is enough ice to raise sea level by roughly 6 feet.
Knowing that the glaciers are melting a lot faster than was previously understood might indeed give us a better insight into what is now happening, but it is also not exactly thrilling news for our species.
Insight 3: Making better choices about what to eat
We do still have choices.
While keeping the warming constrained to just 1.5 or even 2 C is politically beyond our reach, we can still do our best to reduce our own personal emissions. Reducing emissions and so slowing it all down so that we have more time to adapt is a worthy goal to strive for.
The following is not new as such. I’m simply drawing it to your attention as a useful chart to enable you to make better choices.
Via here, we have this chart …
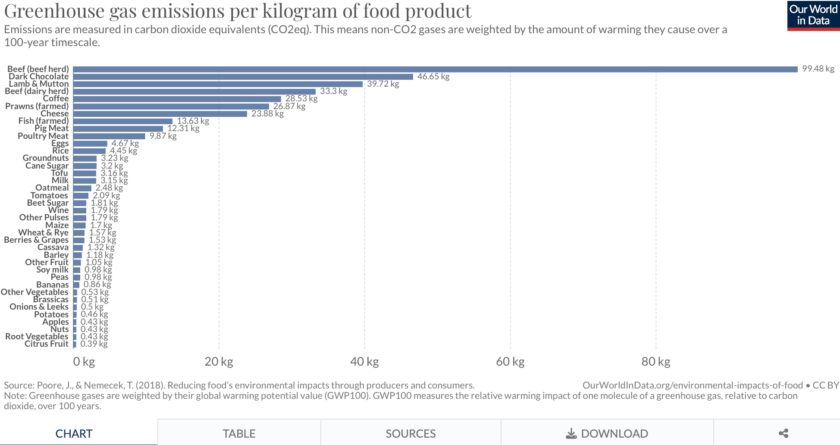
Each and every day we make choices.
Often we make such choices without actually understanding the impact of those choices.
The idea of introducing you to the above is to inspire you to make more informed choices.
For example, a good veggie cookbook for 2023 might indeed not only be a rather good investment, but could also a darn good way to reduce your CO2 footprint.
Food for thought perhaps … literally.