
Roughly about a month ago I was writing about a paper published within Geophysical research papers that was published on December 4th 2019. Titled “Evaluating the performance of past climate model projections”. This compares projections from models going back to the 1970’s with actual observations. The conclusion is that the projections were right.
I’m now once again back to this paper because there has been a bit of an uptick, it is getting some attention. This is not because something is wrong, but because the NASA website has published a posting that highlights it.
Latest Update
The key question being asked by the study is this – just how accurate are climate model predictions?
As explained within this latest posting on the NASA website …
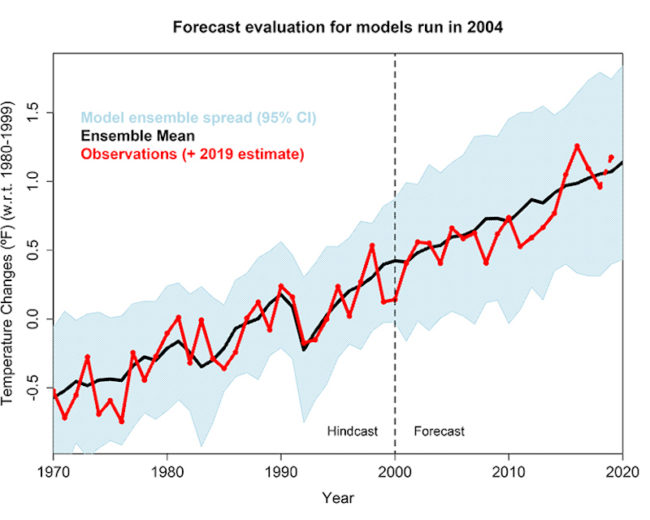
The team compared 17 increasingly sophisticated model projections of global average temperature developed between 1970 and 2007, including some originally developed by NASA, with actual changes in global temperature observed through the end of 2017. The observational temperature data came from multiple sources, including NASA’s Goddard Institute for Space Studies Surface Temperature Analysis (GISTEMP) time series, an estimate of global surface temperature change.
The results: 10 of the model projections closely matched observations. Moreover, after accounting for differences between modeled and actual changes in atmospheric carbon dioxide and other factors that drive climate, the number increased to 14. The authors found no evidence that the climate models evaluated either systematically overestimated or underestimated warming over the period of their projections.
Study Author Comments
Study co-author Gavin Schmidt, director of NASA’s Goddard Institute of Space Studies in New York, is also quoted …
“The results of this study of past climate models bolster scientists’ confidence that both they as well as today’s more advanced climate models are skillfully projecting global warming, This research could help resolve public confusion around the performance of past climate modeling efforts.”
Schmidt also explains that climate models have come a long way. They started out in the 60s with simple energy balance and general circulation models. Today we have increasingly high-resolution and comprehensive general circulation models.
“The fact that many of the older climate models we reviewed accurately projected subsequent global temperatures is particularly impressive given the limited observational evidence of warming that scientists had in the 1970s, when Earth had been cooling for a few decades,”
“As climate model projections have matured, more signals have emerged from the noise of natural variability that allow for retrospective evaluation of other aspects of climate models — for instance, in Arctic sea ice and ocean heat content,” Schmidt said. “But it’s the temperature trends that people still tend to focus on.”
Quick summary
The good news here is this – #Climate models have been very accurate.
The very bad news here is this – #Climate models have been very accurate
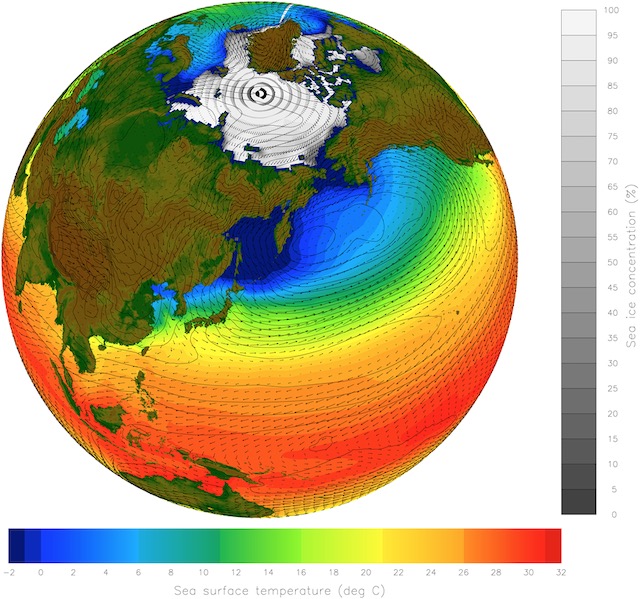
Model Illustration
The above is an animation of a GISS (Goddard Institute for Space Studies) climate model simulation made for the United Nations’ Intergovernmental Panel on Climate Change Fourth Assessment Report, showing five-year averaged surface air temperature anomalies in degrees Celsius from 1880 to 2100. The temperature anomaly is a measure of how much warmer or colder it is at a particular place and time than the long-term mean temperature, defined as the average temperature over the 30-year base period from 1951 to 1980. Blue areas represent cool areas and yellow and red areas represent warmer areas. The number in the upper right corner represents the global mean anomaly. Credit: NASA’s Goddard Institute for Space Studies
Available for download: https://data.giss.nasa.gov/modelE/sc07/
So who do you believe?
It is a choice between the fossil-fuel-industry’s professional climate-denialists or peer-reviewed scientific journals.
Climate Model Study – Further Reading
- Geophysical research papers (4th December 2019) – Evaluating the performance of past climate model projections
There is a paywall there (oh joy!). Worry not, you can grab a non-paywalled copy from the NASA website here …
- Non-Paywalled version
- All the data and code for this study are available here.
One of the study authors wrote about it all in detail on the RealClimate blog here …
There were of course, quite rightly, media stories about this study as well when it first was published…
- Vox – Scientists have gotten predictions of global warming right since the 1970s
- Guardian – Climate models have accurately predicted global heating, study finds
- Washington Post – The simplest of climate models run decades ago accurately projected global warming
- etc…
Now we have this latest NASA posting …