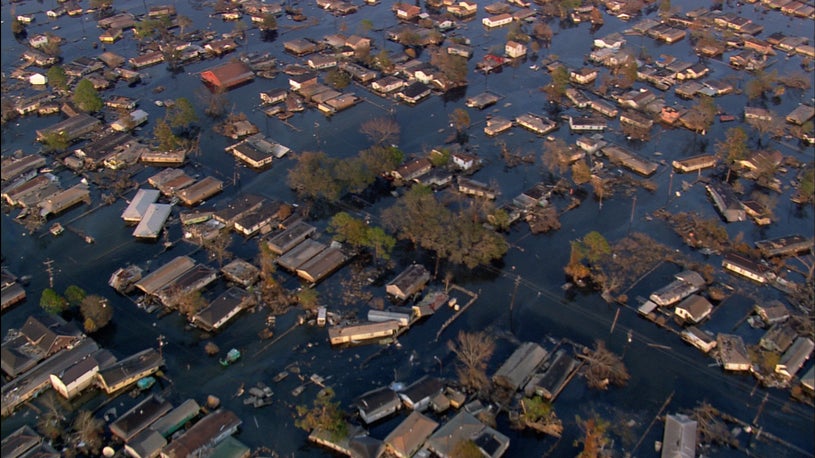
There have been stories in the media regarding the latest sea level rise report. Let’s however bypass those and instead turn directly to the alpha source, the actual report that has been published.
This annual update is based upon data from tide gauges around the US coast. It comes via researchers at William & Mary’s Virginia Institute of Marine Science. The big highlight is that it presents evidence of an accelerating rate of rising levels at nearly all tidal stations.
Nearly all?
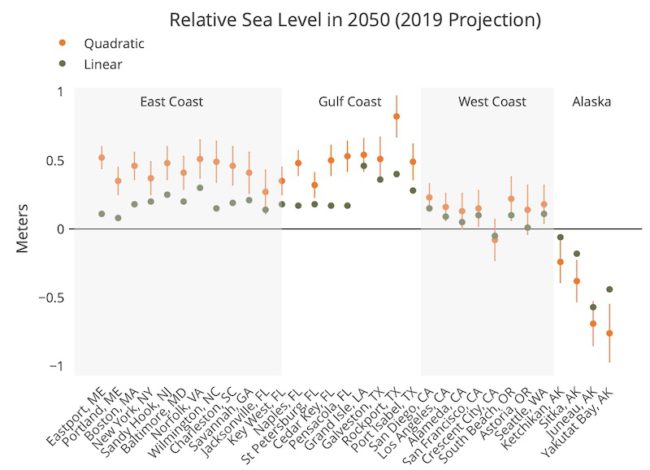
They report that water levels at 25 of 32 stations rose at higher rate than in 2018. Here is a graphical illustration of the details …
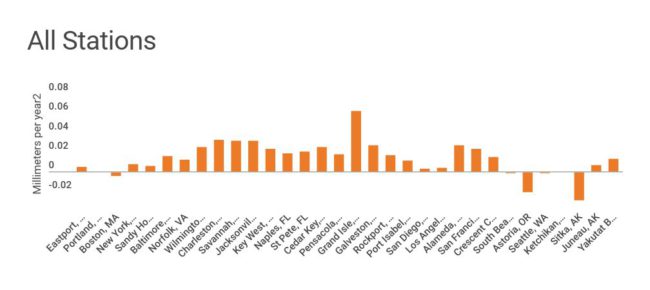
You might wonder why the levels are falling at some stations. All four stations monitored in Alaska show relative sea level is falling at increasingly rapid rates. This is due to coastal mountain-building, the land itself is rising.
The dominant processes affecting measurements along the U.S. West Coast are glacial isostatic adjustment, tectonic processes, and ocean dynamics. Because the magnitude of these processes varies along the coast, tide stations here experience sharply different rates of change.
Notable highlight from the 2019 data
What is perhaps the key observation is this point. Water levels at 25 of the 32 stations rose at a higher rate in 2019 than in 2018.
The report authors attribute the high rise rates and sharp contrast in acceleration among these Gulf Coast stations in part to their location within a sedimentary basin with a complex history of water and mineral extraction. Pumping of groundwater and oil can cause land subsidence, which contributes to the relative rise.
The three highest rates of sea-level rise in 2019 occurred along the Gulf Coast at Grand Isle, Louisiana (7.93 millimeters per year) and at Rockport (6.95 mm/yr) and Galveston (6.41 mm/yr) Texas. Rockport also topped all 32 stations in its rate of acceleration, at 0.26 mm per year per year. If this continues, the level here will be 0.82 meters (2.69 feet) higher in 2050 compared to 1992. Grand Isle and Galveston showed significant but much more moderate acceleration rates in 2019, at 0.05 mm/yr2 and 0.09 mm/yr2, respectively. The 2050 projections for a rise at these sites is thus appreciably lower: 0.54 m (1.77 ft) at Grand Isle and 0.51 m (1.67 ft) at Galveston.
The 2019 report cards show an accelerating rate of sea-level rise at 27 of the 32 monitored stations. After Rockport, the highest rates of acceleration in 2019 were …
- Pensacola, FL and Wilmington, NC (0.22 mm/yr2)
- Cedar Key, FL (0.21 mm/yr2)
- Eastport, ME (0.20 mm/yr2)
- Naples, FL (0.19 mm/yr2)
- Boston, MA (0.17 mm/yr2)
- Portland, ME (0.17 mm/yr2)
- Charleston, SC (0.16 mm/yr2)
- Port Isabel, TX (0.14 mm/yr2).
2050 projections for sea level
The current acceleration in the rates of rise began around 2013 or 2014. Once you have a trend, you can look ahead to see where it is going. The VIMS reports cards do exactly that, they look ahead to see what will have happened by 2050.
The report card authors note that acceleration at various locations sharply increases their quadratic, “best-estimate” projections for 2050, despite in several cases a relatively low 2019 rise rate. For instance, Eastport, Maine had a rise rate of only 1.96 mm in 2019, but sea level there is projected to reach 0.52 m (1.71 feet) by 2050. That 2050 projection is higher than the 0.51-m projection for Norfolk, Virginia (1.67 ft), even though the latter’s 2019 rise rate was 5.33 mm/yr, almost three times higher than in Eastport.
The VIMS team stresses that sea level will also experience short-term variations in the future just as it does today. Thus, coastal residents and planners in Virginia and other areas likely to experience significant sea-level increases by 2050 must also account for storm surges and other transient forces raising sea level even higher than the projected mean rise value. The 95% confidence bands placed about the projected quadratic curve in VIMS’ sea-level report cards are a further reminder that average sea level in any given month can deviate from the projected annual mean by as much as 20 centimeters (8 inches).
The Advantages of a Local Report card
Because long-term changes in sea level are typically on the order of a few millimeters per year, researchers have traditionally felt little need to issue frequent forecasts of sea-level changes. Moreover, many sea-level projections are global in scope, with a forecast horizon of 2100—far enough off to allow for readily discernible linear change. An example is the United Nation’s oft-reported projection of 44 to 74 centimeters (1.4 to 2.4 feet) of absolute sea-level rise by the end of this century.
The VIMS team has purposefully taken a more localized and timely approach. This is designed to add maximum value for coastal residents, businesses, and governments.
“Our report cards show what sea level has been doing recently, what’s happening now at your locality. Numerous studies show that local rates of sea-level rise and acceleration differ substantially from the global rates published by the IPCC and NOAA—a key result because local rates of relative sea-level rise give a direct indication of the extent to which homes, buildings, and roads are at risk of flooding.”
Data subsets
The team’s decision to use a subset of available tide-gauge data runs counter to the traditional approach taken by NOAA, the agency that operates the nation’s official network of tidal stations. “NOAA should be commended for their care in ensuring the continuity, consistency, and availability of the nation’s long-term tidal datasets,” says Boon. “But at the same time, a longer record isn’t always better, especially when there’s evidence of recent non-linear changes in the rate of sea-level rise like we see along the U.S. East Coast.”
An earlier analysis by the researchers showed that this acceleration began in 1987, at the center of a 36-year sliding window beginning in 1969—thus setting the start date for the VIMS report cards. This is decades after many U.S. tide-gauge stations began operation but within a span where many more stations now have complete or nearly complete records. Given recent evidence of ongoing warming, it makes sense in a nation-wide, comparative study of sea-level change to analyze only those observations made over the same period of time.
“If you cross a threshold in terms of something like sea-level rise, what came before—say a tide-gauge record that began in 1900—is biased in terms of seeing where you’re going. We think ice sheets are melting faster today, and if that’s true then the previous 90 years of data won’t accurately predict the future.”
Linear vs Non-Linear sea level rise
The difference between the linear rates used in NOAA’s forecasts and the non-linear, accelerating rates used in VIMS’ report cards can lead to sharply different forecasts of our sea-level future. Extending NOAA’s linear projections to mid-century for the tide gauge in Norfolk, Virginia indicates that sea level here will be 0.3 meters (11.42 inches) higher by 2050, while the VIMS forecast—using a non-linear, accelerating rate—is 0.51 meters, or 20.1 inches. That extra 21 centimeters (8.6”) of sea-level rise would have major implications for the low-lying region.
Subject Matter Expert comments
The project’s founder, VIMS emeritus professor John Boon, …
“the key message from the 2019 report cards is a clear trend toward acceleration in rates of sea-level rise at 25 of our 32 tide-gauge stations. Acceleration can be a game changer in terms of impacts and planning, so we really need to pay heed to these patterns.”
VIMS marine scientist Molly Mitchell – She has partnered with Boon to generate the last two annual report cards. …
“seeing acceleration at so many of our stations suggests that—when we look at the multiple sea-level scenarios that NOAA puts out based on global models—we may be moving towards the higher projections.”
“We have increasing evidence from the tide-gauge records that these higher sea-level curves need to be seriously considered in resilience-planning efforts,”
“Although sea level has been rising very slowly along the West Coast,” says Mitchell, “models have been predicting that it will start to rise faster. The report cards from the past three years support this idea.”
One last observation
None of this report is opinion; nor is it political. Their data comes via actual measurements. Tidal gauges do not vote and do not swing left or right. They are neither red or blue, they simply record what is.
VIMS Sea Level Rise report – Further Reading
- Wikipedia
- VIMS (30 Jan 2020)
- Sea-level report cards: 2019 data adds to trend in acceleration
- The interactive charts are available online at www.vims.edu/sealevelreportcards.
- You can also visit their report card webpage for full-size, interactive versions of all 32 report cards