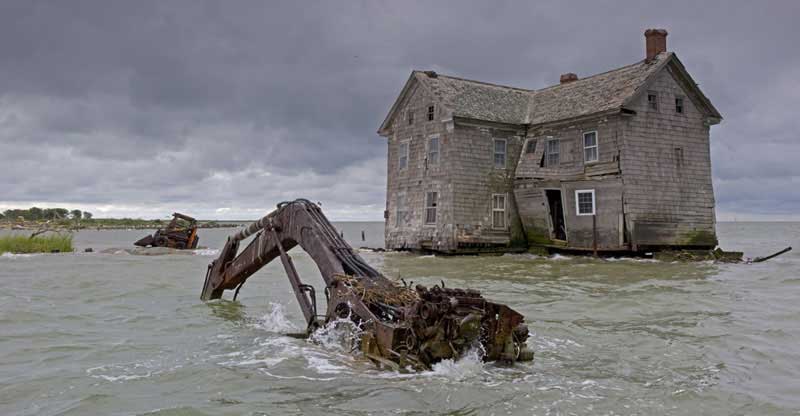
 There is a new study that presents yet more evidence that sea level is not only rising, but that the observed rate of that rise is accelerating.
It is entitled, “Climate-change–driven accelerated sea-level rise detected in the altimeter era“, and has been published this week within the Proceedings of the National Academy of sciences.
Quick Summary – 4 brief findings
- Satellite altimetry reveals that global mean sea level has been rising at a rate of ∼3 ± 0.4 mm/y since 1993.
- Using the altimeter record coupled with careful consideration of interannual and decadal variability as well as potential instrument errors, the paper shows that this rate is accelerating at 0.084 ± 0.025 mm/y2
- This agrees well with climate model projections
- If sea level continues to change at this rate and acceleration, sea-level rise by 2100 (∼65 cm) will be more than double the amount if the rate had stayed at a constant 3 mm/y
In a bit more detail
Tidal gauge records go back a lot further but do have data quality problems. For example, the land on where such gauges sit can itself rise and fall, hence it can become quite challenging to come up with a very precise measurement – an analysis of that data needs to take such issues into account. What we do now have is satellite data that goes back over a span of roughly 25 years. This is a far more accurate means for measuring sea level on a global scale.
Satellite data also is not without problems, and so the paper discusses the various challenges that they faced along with the precise details of how they overcame those challenges. For example they needed to handle what is called “instrument drift” which can lead to errors in the satellite measurements.
Where is the rise in sea level coming from?
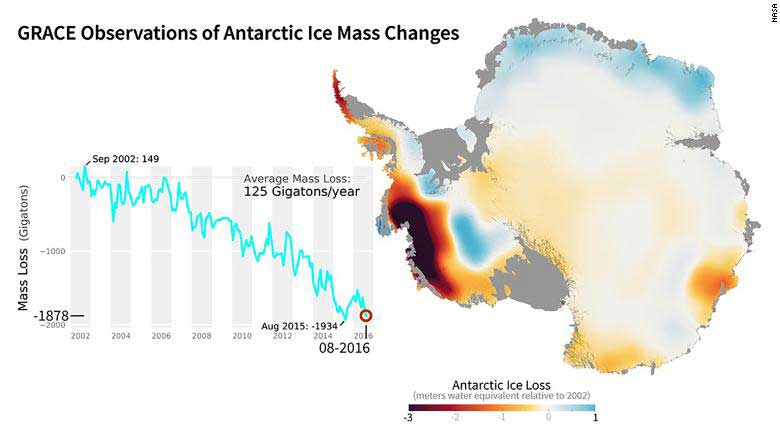
Interestingly enough, they actually have some very precise numbers for the various sources. The data they have for this comes from the Gravity Recovery and Climate Experiment (GRACE) mission. It provides estimates of the contributions to the acceleration of sea-level rise (since 2002).
This is how it breaks down …
- Greenland – 0.66 mm/y
- Antarctica – 0.19 mm/y
- Mountain glaciers – 0.51 mm/y
- Thermal Expansion – 1.65 mm/y
… giving a total increase of 3.01 mm per year.
It is fascinating how various news article place a different emphases …
Guardian – Melting ice sheets are hastening sea level rise, satellite data confirms
… well yes, ice melt, yet slightly over half of it so far has been thermal expansion and not ice melt, principally because most of the extra heat has been absorbed by the world’s oceans.
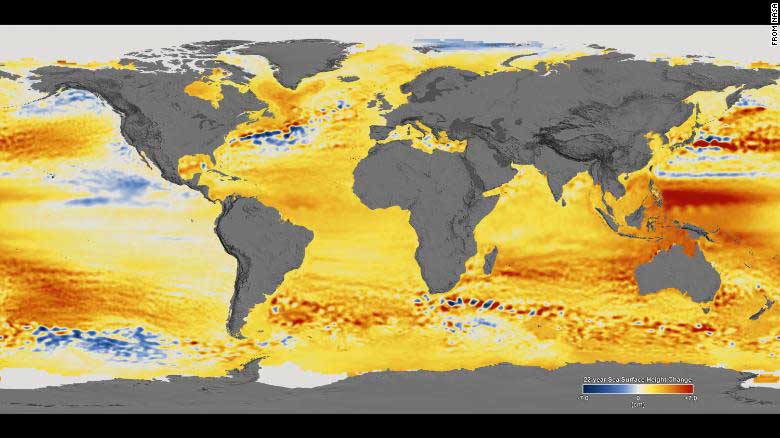
Images
Here are some visualisations of the data, not from the paper, but rather from here on CNN …
Comments
University of Colorado-Boulder professor of aerospace engineering sciences Steve Nerem, lead author …
“Sixty-five centimeters is probably on the low end for 2100, since it assumes the rate and acceleration we have seen over the last 25 years continues for the next 82 years. We are already seeing signs of ice sheet instability in Greenland and Antarctica, so if they experience rapid changes, then we would likely see more than 65 centimeters of sea level rise by 2100”
Penn State climate scientist Michael Mann, (not involved with the study), comments as follows …
“it confirms what we have long feared: that the sooner-than-expected ice loss from the west Antarctic and Greenland ice sheets is leading to acceleration in sea level rise sooner than was projected.”
Related Tweets
You are here.
800,000 years of atmospheric carbon dioxide. This is human-caused #climatechange. pic.twitter.com/58cA3v4ldE— Peter Gleick (@PeterGleick) February 12, 2018
Global sea ice has made a new record low.
There's likely never been this little sea ice on the planet since human civilization began. pic.twitter.com/g4v6SJFGcw
— Eric Holthaus (@EricHolthaus) February 12, 2018
Sea level rise is happening now, and the rate at which it is rising is increasing every year, according to a… https://t.co/SlGtCpJUvB
— Skeptical Science (@skepticscience) February 12, 2018