

The Global #Climate update issued by Copernicus, the European Union’s Earth Observation Programme, is now available. It is the October 2020 edition. This monthly bulletin presents the current condition of the climate using key climate change indicators, so paying attention to this gives you a bit of an insight into what is happening to our climate.
Side Note: The name Copernicus was picked for this body as a way to honour the Renaissance-era mathematician Nicolaus Copernicus. He rather famously formulated a model of the universe that placed the Sun rather than Earth at the center of the universe. In other words, evidence-based truth took precedence over belief.
#Climate Highlights for Oct 2020
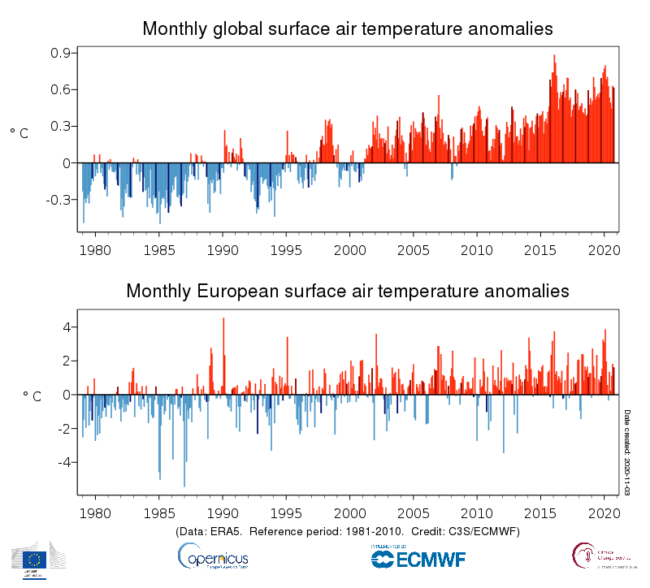
- Europe saw its warmest October on record, with much above average temperatures in the east, but below average in the southwest.
- Globally, it was the third warmest October in our record. The six warmest Octobers have all occurred in the last six years.
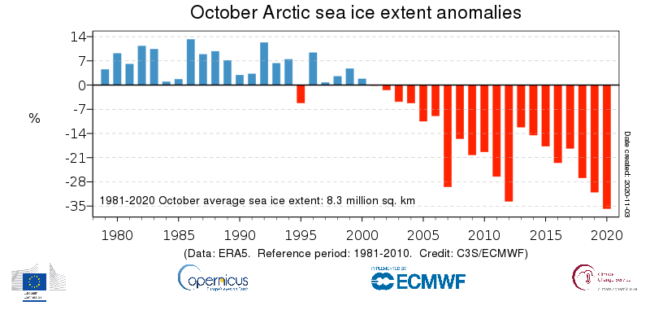
- In the Arctic, sea ice extent was the lowest for October since satellite measurements began in 1979. Meanwhile, in the Antarctic levels were above-average extent for the second month in a row, after 48 months of below-average extent.
Facts and figures don’t communicate all that well, so they have a YouTube clip, a brief one, to help …
In the above they report from Romania on the link between biodiversity and climate change, with projects to build bridges for bears and bring back the bison.
#Climate Details
They also have details for Oct …
Here are a few notable details.
If you look back at every October and create a chart for each and every October, then this emerges …
You can also look back at surface air temperatures for the last 12 months and so this is what that looks like …
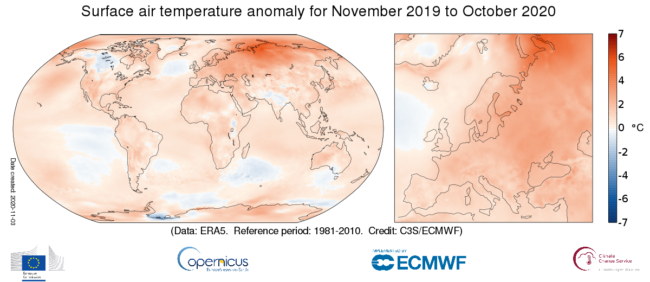
Temperatures averaged over the twelve-month period from November 2019 to October 2020 were:
- mostly above the 1981-2010 average over a large part of Siberia, and the Arctic Ocean to the north of Siberia and Alaska
- above average over virtually all of Europe, more so in the east
- above average over most other areas of land and ocean
- below average over a few land areas, particularly parts of western Canada and northern India
- below average over the eastern equatorial Pacific, the North Atlantic west of Ireland and several oceanic areas in the Southern Hemisphere.
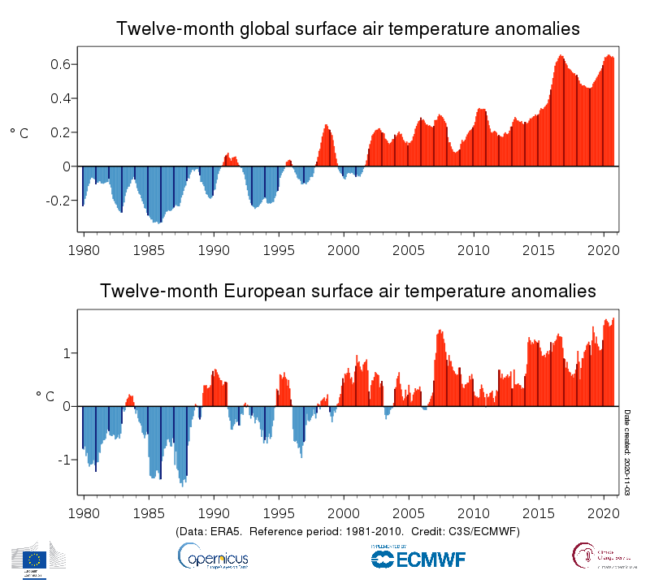
To place that in context, here is a chart going back and looking to see what is going on over time …
#Climate – Arctic
The other very notable observation was this – The Arctic saw its lowest average October sea ice extent since satellite measurements began in 1979. October was the fourth consecutive month with ice-free or close to ice-free conditions along the Northern Sea Route.
On a global scale, yes the the Antarctic saw a second month of above average extents, but that was following 48 consecutive months of below average extent.
The place that Arctic October observation on a bigger scale, here is what is happening to sea ice for every October going back to 1979 …
In Summary
There is of course, as always, a great deal more detail, I’ve simply plucked out a few highlights.
The trend is abundantly clear, it is all part of the far bigger story of the ongoing climate change that is unfolding.
Day to day we might not be conscious of it, but the data is there and it is telling us a story. It really is one that we should be not simply paying attention to, but instead it should motivate us to take meaningful decisive action to address what is unfolding.
It is not yet too late.