
Each and every week new papers and reports are published. Slowly slowly, one step at a time, our understanding expands. One big chunky report that is now available is the official “State of the Climate 2018” document. It was published by by American Meteorological Society on 27th Sept.
You might ask yourself – “Why read about 2018 when most of 2019 is more or less done?“
To answer that let’s briefly dip in and see what insights we can gain.
Will it simply be dull facts and figures telling us that it was cold in winter and warm in summer?
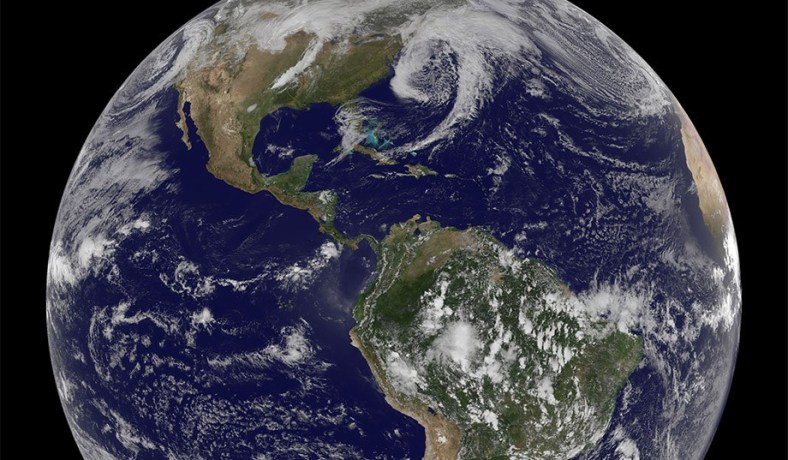
State of the Climate 2018
First a quick side-step; where is it?
You can find it here …
- State of the Climate in 2018 – available (Open access) on 27th Sept
It is long and detailed with vast numbers of contributors. For a quick pass at what it says they also have the following …
- A Look at 2018: Takeaway Points from the State of the Climate Supplement
The Most important insight – this is the Number 1 item
Digest this …
In 2018, the dominant greenhouse gases released into Earth’s atmosphere—carbon dioxide, methane, and nitrous oxide—continued to increase and reach new record highs.
That’s perhaps a tad too scientific for some to grasp, so permit me to translate that …
Hey guys, we still have a fundamental problem. Unless this upwards trend changes, then we are well and truly fucked.
What follows after that is all detail. If you take nothing else away from it except this, then you have in effect distilled the pure essence of it.
What Highlights does it contain?
- The annual global average carbon dioxide concentration at Earth’s surface rose to 407.4 ± 0.1 ppm, the highest in the modern atmospheric measurement record and in ice core records dating back as far as 800,000 years.
- Every year since the start of the twenty-first century has been warmer than the 1981–2010 average.
- Glaciers across the world continued to lose mass for the 30th consecutive year.
The Oceans are heating up
Record high global ocean heat content in 2018
The global oceans serve as the memory of the climate system up to millennial time scales. They absorb, store, and transport energy through their depth and across longitude and latitude. Upper ocean heat content (UOHC)—the amount of energy stored in the top 700 m of the ocean—is one of the definitive measurements of cumulative change in the ocean. Six UOHC datasets indicate large increases since the late twentieth century; five of the six indicate that 2018’s UOHC was the largest annual value of the record.
The structure of the global oceans is changing
Sea surface salinity trends since 2005
The hydrological cycle is accelerating globally. Over the oceans, this manifests in sea surface salinity anomaly patterns: dry regions are becoming drier and saltier, and wet regions rainier and fresher. The upper 600 m of the Atlantic has steadily become saltier from 2005 to 2018; 2018 is the first year with all monthly salinity anomalies in the upper 1500 m of the Atlantic saltier than the long-term mean.
The total Accumulated Cyclone Energy increased
Each Northern Hemisphere tropical cyclone basin was above its 1981–2010 average for Accumulated Cyclone Energy (ACE) during the 2018 season. The eastern North Pacific set a new basin record for ACE. The North Atlantic basin had an ACE of nearly 145% of its 1981–2010 median value. Both the North and South Indian Ocean were above their median ACE value. Only the southwest Pacific and Australian basins were below average for the Southern Hemisphere’s 2017/18 season.
Bering Sea ice extent is collapsing
The Bering Sea, which separates Alaska and Russia roughly south of the Arctic Circle, witnessed significant reductions in sea ice during the October–June 2017/18 sea ice season, leading to record low ice extent for almost the entire ice season. The lack of ice influenced regional ecosystems and communities that depend on the ice as a protective barrier against winter storm surges and as a platform for hunting and travel.
Hurricane Michael
Hurricane Michael intensified rapidly approaching the Florida Gulf Coast in October. It was the most intense tropical cyclone to make landfall in the United States since 1992, and the most intense for the Florida Panhandle since accurate records began in the late 1800s. Michael and Florence, which made landfall in the Carolinas in September, each caused roughly $25 billion (U.S. dollars) in direct losses but were quite different in their character. Florence was a slow-moving storm upon landfall and caused tremendous inland flooding. Michael, in contrast, was a fast-moving storm that did substantial wind damage many miles inland.
Sargassum bloom in the tropical North Atlantic and Caribbean Sea

Two types of harmful blooms, Sargassum, shown here, and K. Brevis, known for causing “red tide,” affected the waters in and around the Caribbean at significantly increased geographical range for much of 2018. Each organism, when in expansive bloom, can cause significant stress to ecosystems and economic losses across tourism, and recreational and commercial fisheries.
European Heat
European continent experiences second warmest year
All of Europe was warmer than average during 2018, as shown by the annual temperature anomalies in the map above. Overall, it was the second warmest year on record for the continent since at least 1950.
The Australian Climate
Australia experiences third lowest rainfall during its cold season
For the April–September period, rainfall was the third lowest on record for Australia. Nationally, September was the driest on record for the month, and the second driest for any month on record behind only April 1902.
Last Word on State of the Climate
Not only have we have not fixed the problem, but we have not even truly begun to fix the problem. Until the ever increasing rates of greenhouse gas emissions pause and start a downwards trend, then we will inevitably reap the consequences in the centuries to come.
The tragedy is that we will have done all this in the full knowledge that if we had sufficient political will to do so, then things could have been different. By the time it becomes blindly obvious to all, it will be too late to reverse it.
State of the Climate – Links to the report
- State of the Climate in 2018 – available (Open access) on 27th Sept
- A Look at 2018: Takeaway Points from the State of the Climate Supplement