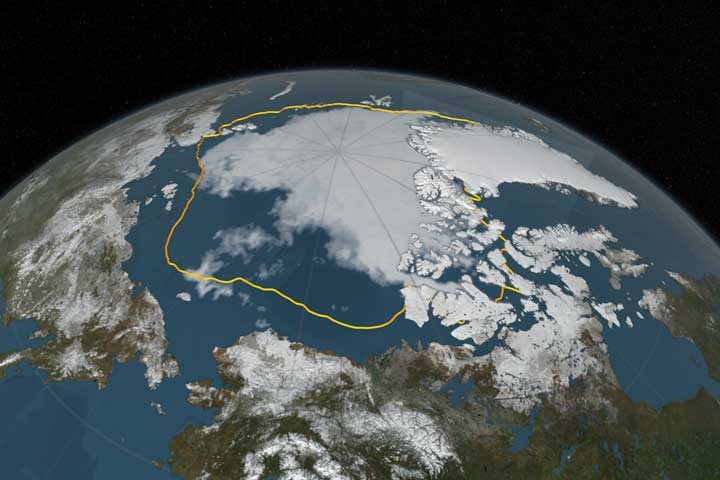
The Arctic sea ice extent has never been seen this low before at this time of year.
Right now in the middle of winter it should be growing, but it is not, the growth has once again stalled.
To drive this point home, here are a couple of extracts from Michael Le Page’s Jan 16th article in New Scientist …
The area of the world’s oceans covered by floating sea ice is the smallest recorded since satellite monitoring began in the 1970s. That means it is also probably the lowest it has been for thousands of years …
…The extent of Arctic sea ice should be growing rapidly during the northern hemisphere winter. But not only has the Arctic been warming rapidly, this winter repeated incursions of warm air have pushed temperatures even further above average.
It has been so warm that on occasions this winter the sea ice coverage has actually temporarily shrunk,…
…In the Arctic, by contrast, there is a long-term decline in sea ice due to global warming. This warming seems to be weakening the winds that circle the pole, allowing warm air to intrude into the Arctic.
And when warm air intrudes, cold air spills south. This is why parts of Asia and Europe have experienced unusually cold weather at times this winter….
You might perhaps criticise me for repeating myself and yet again posting about this, but right now I would argue that this is the most important story. In the long term, this unfolding saga will be remembered.
It is a continuous and unfolding story of a rapid decline in the extent of the Arctic sea ice. This is not a natural variability, we are doing this. It is a rather stark illustration of the impact of global warming. Total #Arctic sea ice collapse is not an “if”, it is simply a matter of “when” and that “when” is fast approaching.
It is perhaps also worth noting that the sea ice extent might rebound a bit next year. That however would not be a reprieve. Short term bounces should not simply be expected, but should be anticipated. The big picture here is the longer term downward trend, and that will continue unabated.
December 2016 – Trends and Calculations
 Wait … I thought that Dec 2016 was the lowest ever sea ice extent in the Arctic, why does the above show something different?
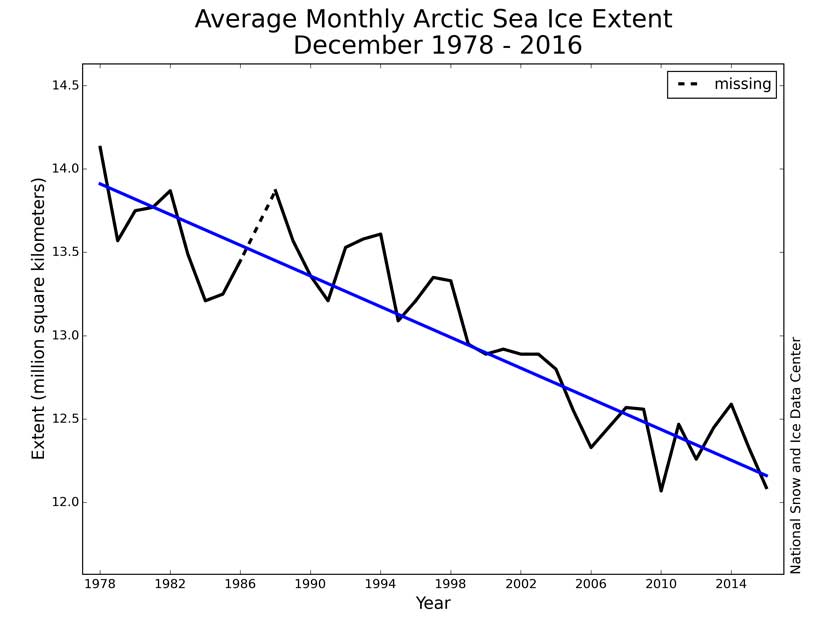
NSIDC explains the above diagram as follows …
Through 2016, the linear rate of decline for December is 44,500 square kilometers (17,200 square miles) per year, or 3.4 percent per decade.
While daily extents for December 2016 were at record lows, based on the method employed by NSIDC, the monthly average extent for December 2016 was slightly higher than that recorded for December 2010, the record low December in the satellite record. The monthly average extent for the month of December is higher than the month’s average of daily extents because of the way in which the Sea Ice Index algorithm calculates the monthly extent. The algorithm calculates the monthly average total extent from the monthly average gridded concentration field. Thus, when sea ice is retreating or advancing at a high rate over the course of the month, as was the case for December 2016, the Sea Ice Index monthly average can yield a larger extent than from simply averaging daily extent values. See the Sea Ice Index documentation for further information.
The unfolding #Arctic story – Tweets
Maybe daily updates are excessive, but I think it's a story that should be told… Record low #Arctic sea ice extent continues (@NSIDC data) pic.twitter.com/mFZZeNEWO6
— Zack Labe (@ZLabe) January 15, 2017
We have yet to hit 13 million km^2 in NSIDC #Arctic SIE. Previous latest date to hit 13 million km^2 was January 8th of last year. @ZLabe pic.twitter.com/Jv8vccopzh
— Paul Mykolajtchuk (@paul_wx) January 16, 2017
Really the last forecast #seaice needs… Strong/persistent storminess in the Atlantic basin of the #Arctic -> wind/waves + already thin ice pic.twitter.com/H2BaFMSPoK
— Zack Labe (@ZLabe) January 16, 2017
Ah, geez, there's the big temperature spike (well above average) today from the current weather setup in the #Arctic… pic.twitter.com/I8xnR8km30
— Zack Labe (@ZLabe) January 17, 2017
#climatechange is a fact – 4maps of the #Arctic from National Geographic (published 1999-2014) are convincing. pic.twitter.com/votc7iURH9
— Resilience Solutions (@Resilience_S) January 16, 2017
Final version of the Global Sea Ice Area spiral plot #climatechange #globalwarming pic.twitter.com/TfJYuvEwrZ
— Kevin Pluck – Megalomaniacal Authoritarian (@kevpluck) January 5, 2017
Further Reading
- New Scientist (16thJan) – Global sea ice is at lowest level ever recorded
- Engadget (17th Jan) – We’ve never seen global sea ice levels this low before
- Guardian (8th Jan) – Thawing Arctic is turning oceans into graveyards
- Business Insider (10 Jan) – The Arctic sea ice collapse is happening before our eyes — and it’s a worrisome sign of what’s to come