 If you still have doubts regarding the reality of Climate Change, then you really do need to read the article that Dan Sung has written within the UK’s Independent. Oh and yes, that picture above comes with the article.
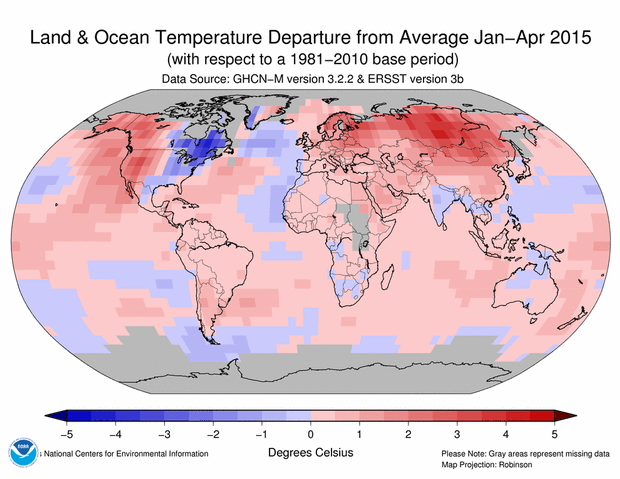
Do you remember that US Senator harping on about Climate Change being a myth because the temperature outside was unusually cold? It was Jim Inhofe, the Chair of the Senate Committee on Environment and Public Works He brought a snowball on to the Senate floor and tossed it before delivering remarks in which he claimed that environmentalists keep talking about global warming even though it keeps getting cold. Well that blue spot over the US confirms that it was indeed unusually cold, and in contrast to that, everywhere else was usually warm. The issue here is not just what is going on outside his window, but rather what do the numbers across the entire planet tell us.
To explain that, Dan writes as follows within the Independent …
The last 12-month period has seen the highest global temperatures on the planet, according to figures from the National Oceanic and Atmospheric Administration (NOAA), and, even though we’re barely halfway through, it’s clear that 2015 is set to be record breaking year.
Not since the 1970s have land and sea measurements dropped beneath the expected average and all the data from environmental watchdogs points towards a steady rise currently at one degree C above where it should be.
It might seem like just a small amount but yet the geographical impact is reported on a daily basis at the polar ice-caps and coastal regions
He then goes on to expand upon how this will impact us.
So are these numbers that the article is based upon correct?
Short Answer is yes.
The longer answer is that the NOAA April 2015 Analysis can be found on-line here and does indeed confirm that this is all factual.
There they lay it all out …
The average temperature across global land and ocean surface temperatures combined for April 2015 was 0.74°C (1.33°F) higher than the 20th century average. This was the fourth highest for April in the 136-year period of record, but also marks the lowest monthly departure from average since November 2014.
Examining the data beyond the traditional calendar year, the latest 12-month period (May 2014–April 2015) ties with the record set last month (April 2014–March 2015) as the warmest 12-month period among all months in the 136-year period of record, as shown in the table below. In fact, this record was set several times over the past year, and nine of the ten warmest 12-month periods have occurred within the past two years (September 1997–August 1998 ties as eighth warmest). Nine of these ten 12-month periods also comprise months in two overlapping years. Only the full calendar year of 2014 is among the ten warmest 12-month periods (ties for sixth warmest).
| RANK 1 = WARMEST PERIOD OF RECORD: 1880–2015 |
12-MONTH PERIOD | ANOMALY °C | ANOMALY °F |
|---|---|---|---|
| 1 (tie) | May 2014–April 2015 | 0.75 | 1.35 |
| 1 (tie) | April 2014–March 2015 | 0.75 | 1.35 |
| 3 | March 2014–February 2015 | 0.74 | 1.33 |
| 4 (tie) | February 2014–January 2015 | 0.70 | 1.26 |
| 4 (tie) | November 2013–October 2014 | 0.70 | 1.26 |
| 6 (tie) | January 2014–December 2014 | 0.69 | 1.24 |
| 6 (tie) | October 2013–September 2014 | 0.69 | 1.24 |
| 8 (tie) | December 2013–November 2014 | 0.68 | 1.22 |
| 8 (tie) | September 1997–August 1998 | 0.68 | 1.22 |
| 8 (tie) | September 2013–August 2014 | 0.68 | 1.22 |
When it comes to Climate Change, people may indeed express a different opinion, but what they cannot do is claim a different set of facts.
Bottom line, it is indeed getting warmer …
The first four months of 2015 was the warmest such period on record across the world’s land and ocean surfaces, at 0.80°C (1.44°F) above the 20th century average, surpassing the previous record of 2010 by 0.07°C (0.13°F).