
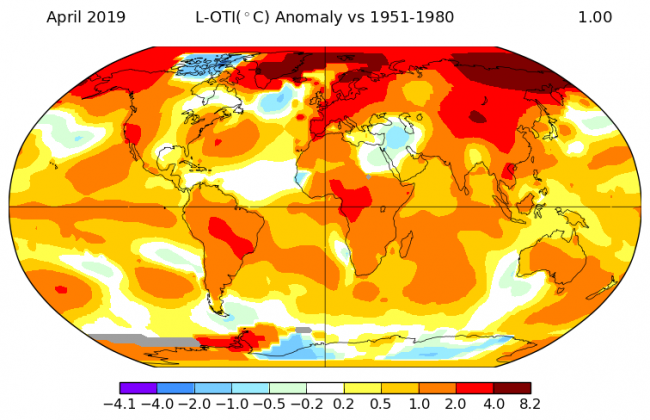
Via NASA, we have the GISS Surface Temperature Analysis. This is an estimate of global surface temperature change that is issued around the middle of every month and gives us a chart that shows us what is going on. Here for example is the illustration by NASA of 2018 in context …
A bit of background
There is a new study regarding the accuracy of GISTEMP, but before we get into that, we need a bit of background.
The basic GISS temperature analysis scheme, GISTEMP, was defined in the late 1970s by James Hansen. The scheme was based on the finding that the correlation of temperature change was reasonably strong for stations separated by up to 1200 km, especially at middle and high latitudes. This fact proved sufficient to obtain useful estimates for global mean temperature changes.
It has since then been through various enhancements. We are now on v3 and soon there will be a v4.
It is all fully documented on the NASA website. The original analysis method was fully described the the Hansen and Lebedeff (1987) paper. The series of enhancements are listed and illustrated on a History Page.
The GISTEMP graphs and tables are updated around the middle of every month using current data files from NOAA/NCEI GHCN v3(meteorological stations), ERSST v5 (ocean areas), and SCAR (Antarctic stations), combined.
Within the next version, GISTEMP v4, GHCN v3 will be replaced with the vastly extended collection of meteorological station reports of GHCN v4
Is GISTEMP reliable?
OK, now let’s get into the details of the new study.
There has been a new and improved uncertainty analysis of the v4 version that has just been published (May 23rd 2019). This analysis can also be applied to the current v3. It is described in detail within the journal article “Improvements in the uncertainty model in the Goddard Institute for Space Studies Surface Temperature (GISTEMP) analysis“.
The code used is written in R and if you wish you can download it and run it yourself. (I’m not kidding, the instructions for doing that can be found here). Simply spin up a virtual machine in Google cloud or similar, download, and proceed to run it. (Side note: I’m running this blog off a virtual machine I’ve spun up in GCP).
To answer the question about reliability – this study is the most complete assessment ever of statistical uncertainty within the GISS Surface Temperature Analysis (GISTEMP) data product. It shows that the annual values are likely accurate to within 0.09 degrees Fahrenheit (0.05 degrees Celsius) in recent decades, and 0.27 degrees Fahrenheit (0.15 degrees C) at the beginning of the nearly 140-year record.
Translation please
Let me translate that for you. The key message is this – The Earth’s global temperature increase since 1880 – about 2 degrees Fahrenheit, or a little more than 1 degree Celsius – cannot be explained by any uncertainty or error in the data.
If we define “Normal” as a baseline period of 1951-80, then compared to that, 2018 was the fourth-warmest year on record, with 2016 holding the top spot (See the You Tube clip above).
What is the uncertainty all about?
We have readings from weather stations scattered all around the globe. If the distance between them is as far as 1200 km, then what happened in those gaps, and how certain can we be of that by just using the data we have from the weather stations. Do we truly have a complete global picture?
That’s the degree of uncertainty.
The big discovery by Hanson and others is that we could calculate an estimate using the data we had. This is a process called interpolation.
What can also be done is to quantify the statistical uncertainty present in those estimates. That helps researchers to be confident that the interpolation is accurate, and that is what this new study is all about.
Imperfect Knowledge
“Uncertainty is important to understand because we know that in the real world we don’t know everything perfectly,” said Gavin Schmidt, director of GISS and a co-author on the study. “All science is based on knowing the limitations of the numbers that you come up with, and those uncertainties can determine whether what you’re seeing is a shift or a change that is actually important.”
The study found that individual and systematic changes in measuring temperature over time were the most significant source of uncertainty. Also contributing was the degree of weather station coverage. Data interpolation between stations contributed some uncertainty, as did the process of standardizing data that was collected with different methods at different points in history.
After adding these components together, GISTEMP’s uncertainty value in recent years was still less than a tenth of a degree Fahrenheit, which is “very small,” Schmidt said.
The team used the updated model to reaffirm that 2016 was very probably the warmest year in the record, with an 86.2 percent likelihood. The next most likely candidate for warmest year on record was 2017, with a 12.5 percent probability.
“We’ve made the uncertainty quantification more rigorous, and the conclusion to come out of the study was that we can have confidence in the accuracy of our global temperature series,” said lead author Nathan Lenssen, a doctoral student at Columbia University. “We don’t have to restate any conclusions based on this analysis.”
One other important point
To help you understand that we can indeed be confident, it is also worth understanding that GISTEMP via NASA is not the only game in town. There are other independently maintained datasets. For example …
- NOAA maintains the Global Historical Climatology Network (GHCN-Monthly) data base containing historical temperature, precipitation, and pressure data for thousands of land stations worldwide.
- NOAA’s National Climatic Data Center (NCDC) of surface temperature measurements also maintains a global temperature record since 1880.
- There there is HadCRUT. This is a collaboration between the University of East Anglia‘s Climatic Research Unit and the Hadley Centre for Climate Prediction and Research.
- We also have the Berkeley Earth Surface Temperature dataset.
So the key question is this. If we put them side by side and compare them, then what do we find?
They align. They are all telling us exactly the same …
Can we truly be sure?
Short answer – yes.
Slightly longer answer.
Another recent study evaluated GISTEMP in a different way that also added confidence to its estimate of long-term warming. A paper published in March 2019, led by Joel Susskind of the NASA Goddard Space Flight Center, compared GISTEMP data with that of the Atmospheric Infrared Sounder (AIRS), onboard the NASA Aqua satellite.
GISTEMP uses air temperature recorded with thermometers slightly above the ground or sea, while AIRS uses infrared sensing to measure the temperature right at the Earth’s surface (or “skin temperature”) from space. The AIRS record of temperature change since 2003 (which begins when Aqua launched) closely matched the GISTEMP record.
Comparing two measurements that were similar but recorded in very different ways ensured that they were independent of each other, Schmidt said. One difference was that AIRS showed more warming in the northernmost latitudes.
“The Arctic is one of the places we already detected was warming the most. The AIRS data suggests that it’s warming even faster than we thought,” said Schmidt, who was also a co-author on the Susskind paper.
Taken together, Schmidt said, the two studies help establish GISTEMP as a reliable index for current and future climate research.
“Each of those is a way in which you can try and provide evidence that what you’re doing is real,” Schmidt said. “We’re testing the robustness of the method itself, the robustness of the assumptions, and of the final result against a totally independent data set.”
In all cases, he said, the resulting trends are more robust than what can be accounted for by any uncertainty in the data or methods.