
The numbers are starting to come in. The EU’s Copernicus have issued a press release that announces that their data for 2020 reveals the following …
- 2020 was the warmest year ever … in Europe
- 2020 ties with 2016 for warmest year recorded
Side Note: If you are wondering why the European Union’s Climate Change Service (C3S) is named Copernicus, it is perhaps worth remembering that Nicolaus Copernicus is the guy who rater famously deduced the heliocentric model (the idea that the earth revolves around the sun) via observational data in the early 1500’s.
A Bit more Detail on 2020
CO2 is still rising
The Copernicus Atmosphere Monitoring Service (CAMS), C3S reports that CO2 concentrations in the atmosphere have continued to rise at a rate of approximately 2.3 ppm/year in 2020 reaching a maximum of 413 ppm during May 2020.

Surface air temperatures
- Globally, 2020 was on a par with the 2016 record
- 2020 was 0.6°C warmer than the standard 1981-2010 reference period and around 1.25°C above the 1850-1900 pre-industrial period
- This makes the last six years the warmest six on record
- Europe saw its warmest year on record at 1.6°C above the 1981-2010 reference period, and 0.4°C above 2019, the previous warmest year
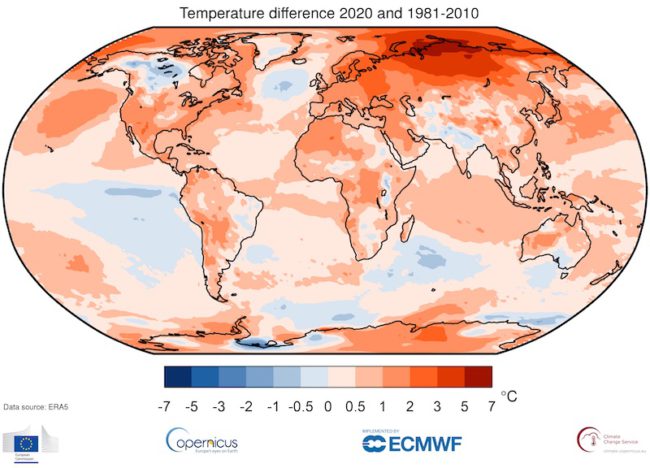
- The largest annual temperature deviation from the 1981-2010 average was concentrated over the Arctic and northern Siberia, reaching to over 6°C above average

The 2020 Siberia Anomaly
Parts of the Arctic and northern Siberia saw some of the largest annual temperature deviations from average in 2020, with a large region seeing deviations of as much as 3°C and in some locations even over 6°C for the year as a whole. On a monthly basis, the largest positive temperature anomalies for the region repeatedly reached more than 8°C. Western Siberia experienced an exceptionally warm winter and spring, a pattern also seen over summer and autumn in the Siberian Arctic and over much of the Arctic Ocean.
Furthermore, the wildfire season was unusually active in this region, with fires first detected in May, continuing throughout summer and well into autumn. As a result, poleward of the Arctic Circle, fires released a record amount of 244 megatonnes of carbon dioxide in 2020, over a third more than the 2019 record. During the second half of the year, Arctic sea ice was significantly lower than average for the time of the year with July and October seeing the lowest sea ice extent on record for the respective month.
The Northern Hemisphere
In general, the Northern Hemisphere experienced above average temperatures for the year, apart from a region over the central North Atlantic. In contrast, parts of the Southern Hemisphere saw below average temperatures, most notably over the eastern equatorial Pacific, associated with the cooler La Niña conditions developing during the second half of the year. It is notable that 2020 matches the 2016 record despite a cooling La Niña, whereas 2016 was a record year that began with a strong warming El Niño event.

Comments
“2020 stands out for its exceptional warmth in the Arctic and a record number of tropical storms in the North Atlantic. It is no surprise that the last decade was the warmest on record, and is yet another reminder of the urgency of ambitious emissions reductions to prevent adverse climate impacts in the future.“
Carlo Buontempo, Director of the Copernicus Climate Change Service (C3S)
Links
Access to data
Processed time series data are available to download below the respective graphic. Spatial data for the temperature anomaly map can be downloaded from the Climate Data Store (CDS – cds.climate.copernicus.eu). Data from Copernicus are subject to the Licence to Use Copernicus Products (v 1.2). Temperature datasets from other providers, which are included here for the purpose of comparison, are subject to other licenses, please check with the respective provider.
The complete C3S datasets (ERA5 (1979-2020), ERA5 preliminary (1950-1978) and “C3S XCO2 data derived from satellite sensors” (2003-2019) are available from the CDS. The complete “CAMS XCO2 data derived from satellite sensors” is available from the data provider Univ. Bremen (http://www.iup.uni-bremen.de/~ghguser/).
The Monthly Climate Bulletin for December can be accessed here: https://climate.copernicus.eu/monthly-climate-bulletins