I was listening to a BBC presenter quip the other day that the UK’s weather is always like this at this time of year, and yet if you look back over the actual data regarding extreme weather in the UK then what you discover is that the climate really is changing.
The UK’s Met Office has published the precise details.

State of the UK Climate 2017: Supplementary report on Climate Extremes
Published on Nov 1st 2018 as a supplement to their previously published analysis of 2017 by the Met Office Hadley Center.
Side note: The Hadley Center is focused on climate modelling. They cover both Ocean modelling and Atmospheric Modelling. Collecting data from across the world. You can access their datasets here.
The new report that they have just published reveals further details about changes in the UK’s climate since the 1960s.
You can access the full report here. (PDF)
What did they do?
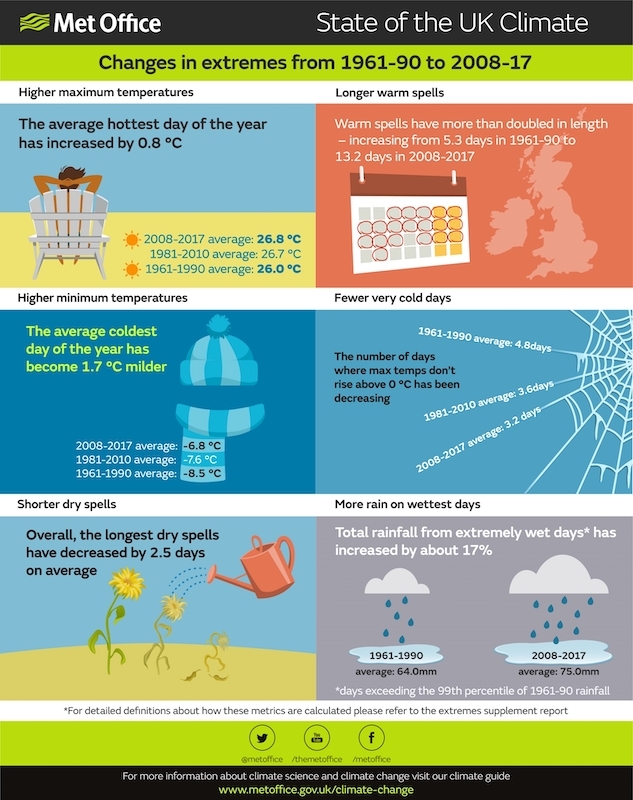
By comparing different meteorological reference periods, a number of interesting trends can be observed. For example, the hottest day of each year over the most recent decade (2008-2017) in the UK has been on average 0.8 °C warmer than the hottest day of each year over the period 1961-1990. Conversely, the lowest temperature of the year has shown an even greater increase, becoming 1.7 °C milder between the two periods in the UK.
This study uses a set of measures agreed around the globe by the World Meteorological Organization and World Climate Research Programme, and are widely used in global climate change research. These metrics include at least one measure – Tropical Nights – which is currently not a common feature of the UK climate, but it could become more widespread in future. Tropical nights are defined as 24-hour periods when the minimum temperature doesn’t fall below 20.0 °C.
In what way exactly has the UK climate changed?
Highest maximum temperature: highest value of daily maximum temperature for each calendar year, averaged over climatological reference periods.
- 1961-1990 average 26.0 °C
- 2008-2017 average 26.8 °C
Summer days: annual count of days where the daily maximum temperature was above 25.0 °C
- 1961-1990 average 4.5 days
- 2008-2017 average 5.3 days
Tropical nights: annual count of days where the daily minimum temperature was above 20.0 °C.
- Currently not common in the UK climate.
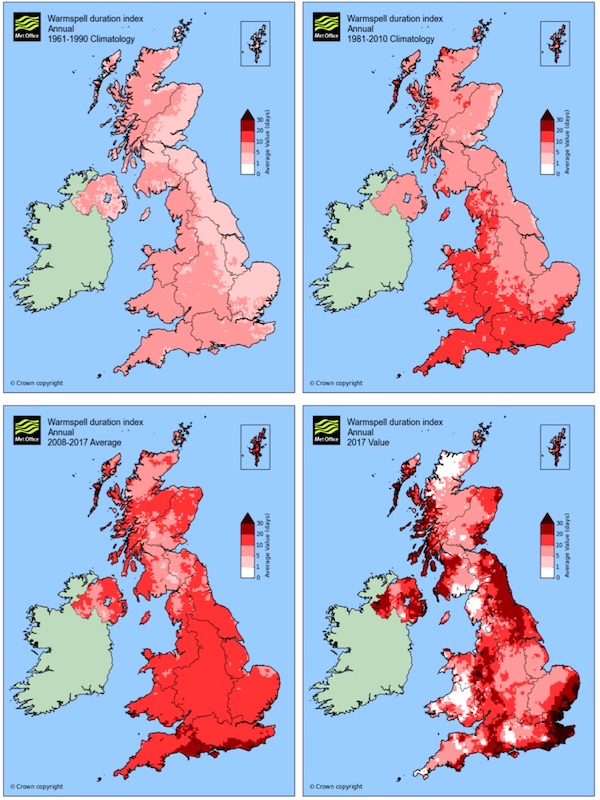
Warmspell duration index: duration of at least six days with daily maximum temperature well above climatological average for the time of year.
- 1961-1990 average 5.3 days
- 2008-2017 average 13.2 days
Warm spells have more than doubled in duration between 1961-1990 and 2008-2017.
Lowest minimum temperature: Lowest value of the daily minimum temperature for each calendar year, averaged over climatological reference periods.
- 1961-1990 average -8.5 °C
- 2008-2017 average -6.8 °C
Icing days: Annual count of days where the daily maximum temperature was below 0.0 C
- 1961-1990 average 4.8 days
- 2008-2017 average 3.2 days
Key rainfall indices and UK results:
Maximum 5-day precipitation: Highest value of the five-day precipitation amount (mm) for each calendar year, averaged over climatological reference periods.
- 1961-1990 average 77.8 mm
- 2008-2017 average 81.4 mm
Longest wet spell: Longest sequence of days with 1 mm or more of rainfall each calendar year, averaged over climatological reference periods.
- 1961-1990 average 12.4 days
- 2008-2017 average 12.9 days
Longest dry spell: Longest sequence of days with less than 1mm of rainfall for each calendar year, averaged over climatological reference periods.
- 1961-1990 average 20.5 days
- 2008-2017 average 18.0 days
Overall, the longest dry spells have decreased by 2.5 days, on average.
Rainfall from extremely wet days: Total annual precipitation from falling on the wettest days, averaged over climatological reference periods.
- 1961-1990 average 64.0 mm
- 2008-2017 average 75.0 mm
Total rainfall rom extremely wet days has increased by about 17%.
Tell me more about those Tropical Nights?
Let me do that with a few graphs that illustrate that this is starting to emerge within the various datasets …
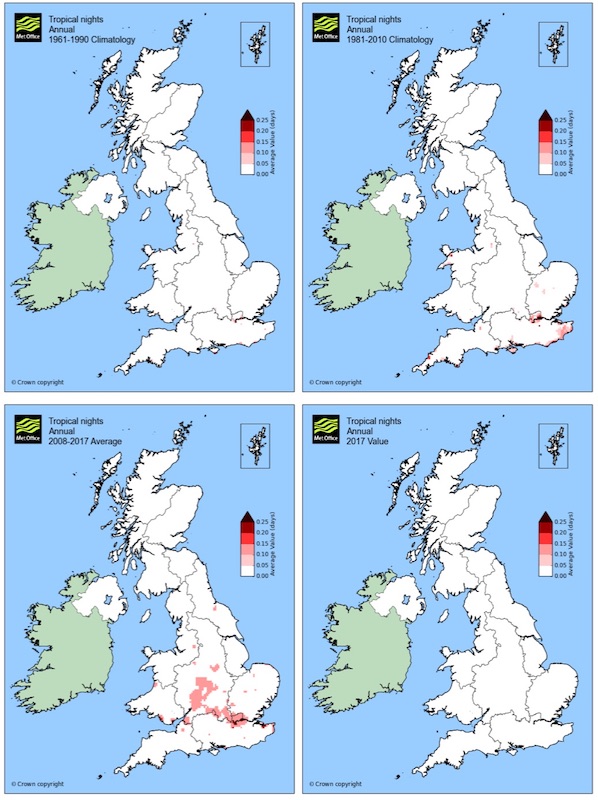
Over time it is anticipated that the Tropical Nights index will be a meaningful measure for the UK, hence it makes sense to establish a baseline for it. What is perhaps a more dramatic illustration of change is the warmspell data …
Study Author Comments
Dr Mark McCarthy is the head of the Met Office’s National Climate Information Centre, the team which produced the report. He said:
“Monthly, seasonal and annual climate data provide a valuable record of the changing climate in the UK. However, these average figures have a tendency to mask extreme weather and climate events. So in our latest report we have focussed on those measures which record weather extremes – complementing our recently published State of the UK climate 2017 report – which shows how the UK’s climate is changing.”
Commenting on the tropical nights measure, Dr McCarthy added:
“Minimum overnight temperatures of over 20.0 °C in the UK are rare currently and even during this summer this threshold was only exceeded on a few occasions. However, with projections in climate suggesting warmer temperatures, it is useful to have this metric in place, so that future changes can be monitored.”