Each year the American Meteorological Society publishes the fully peer-reviewed “State of the Climate”. The 30th edition, the one that now covers 2019, became available on August 12, 2020.
You can obtain the full document here (no paywall).
If that is too big to digest, then try the specific sections of interest.
- Executive Summary
- Table of Contents, Abstract, and Introduction
- Global Climate
- Global Oceans
- The Tropics
- The Arctic
- Antarctica and the Southern Ocean
- Regional Climates
- Relevant Datasets and Sources
Tempting as it is to add commentary, I find that it is perhaps best to simply report the highlights and let the facts stand by themselves.
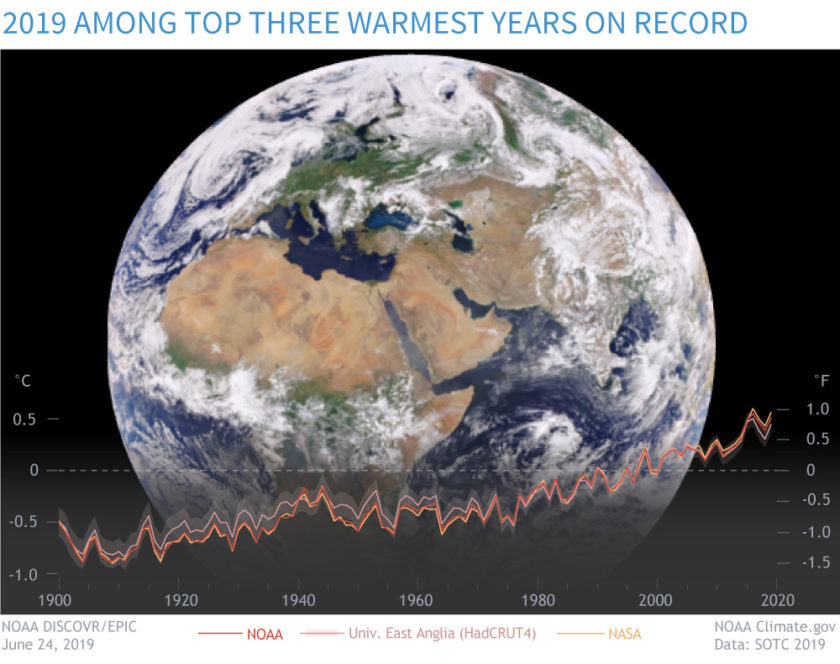
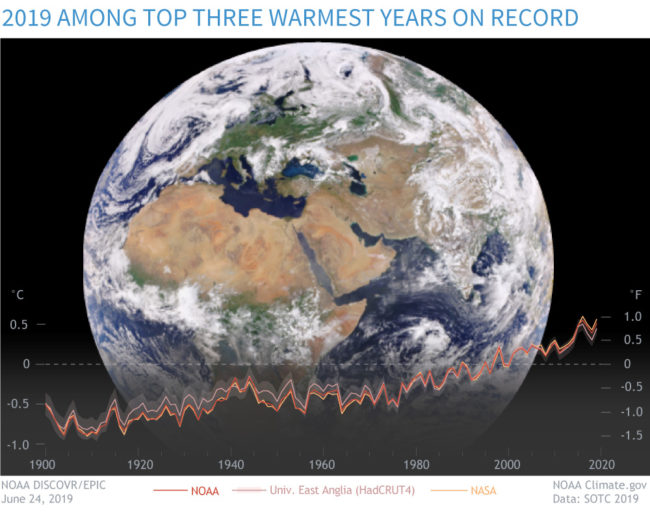
State of the Climate – Global Climate
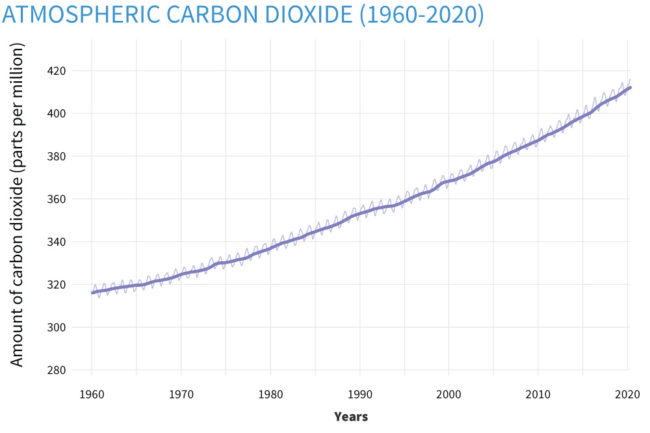
- All major greenhouse gases released into Earth’s atmosphere reached new record high concentrations in 2019.
- They are now at their the highest in the modern instrumental record and in ice core records dating back 800,000 years
- Each decade since 1980 is warmer than its preceding decade, with 2010–19 being around 0.2°C warmer than 2000–09.
- In 2019, there were a record high number of extreme warm days (tem- peratures above the 90th percentile) over global land surfaces. There were also a low number of extreme cool days
- Above Earth’s surface, the annual lower troposphere temperature was third highest to record high
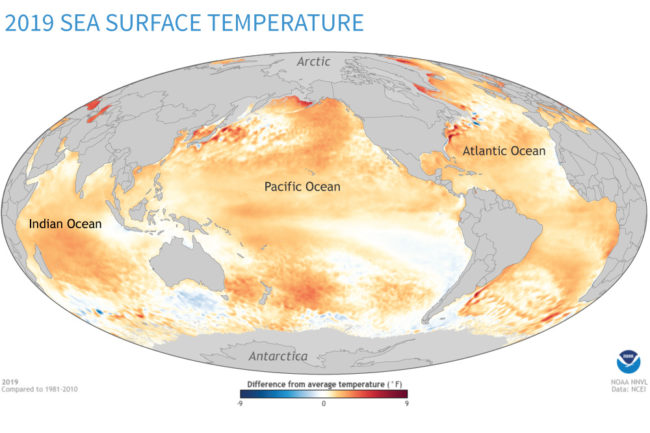
State of the Climate – Global Oceans
- In 2019, global mean sea level set a new record for the eighth consecutive year, an increase of 6.1 mm from 2018.
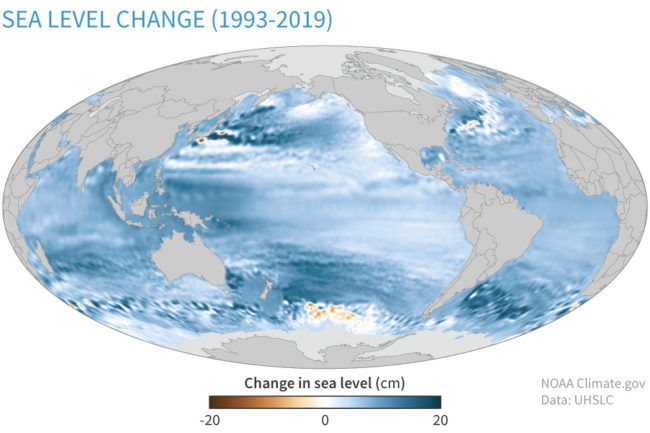
- Record high ocean heat content measured to 700 m depth in 2019 contributed an estimated 4.5 mm of that rise.
- Since 2004, ocean heat content has been increasing at a rate exceeding 0.20°C per decade near the surface and at a lower but still increasing rate of less than 0.03°C decade in deeper waters below 300 m.
- The ocean had a net uptake of about 2.4 billion metric tons of carbon dioxide in 2019.
- This is a record high amount and an increase of 0.2 billion metric tons from 2018, continuing a trend that began at the start of the twenty-first century.
- As a consequence of increased carbon dioxide in the ocean, surface ocean pH has declined by 0.018 ± 0.004 units per decade in most of the ocean, making it more acidic, since the pre-industrial period.
- The Indian Ocean dipole, which is the difference in sea surface temperatures between the western and eastern Indian Ocean, reached a historic high positive value in October 2019, associated with dramatic upper ocean warm- ing in the western Indian Ocean basin.
- This difference re- sulted in more precipitation in the west and drier conditions in the east in 2019, which led to fresh waters in the west and salty surface waters in the east.
- In the North Pacific Ocean, sea surface temperatures increased significantly in the latter half of the year, leading to the reemergence of a “warm blob” that was also related to a decrease in precipitation
Storms
In total, 96 named tropical cyclones were observed during the combined Northern Hemisphere and Southern Hemisphere storm seasons, well above the 1981– 2010 average of 82.
- Five tropical cyclones across the globe reached Saffir–Simpson Hurricane Wind Scale Category 5 intensity level
- The Accumulated Cyclone Energy index—a measure of the total of each individual storm’s wind energy throughout its life— was above average in each tropical cyclone basin in the Northern Hemisphere.
- It was the highest on record for the North Indian Ocean, nearly double the previous records in 2007 and 2013 and more than four times higher than the 1981–2010 average
State of the Climate – The Tropics
The annual average temperature across land and ocean sur- faces between 20°N and 20°S was +0.47°C above the 1981–2010 average, making 2019 the third-warmest year for the tropics since records began in 1880, and the warmest since 2016.
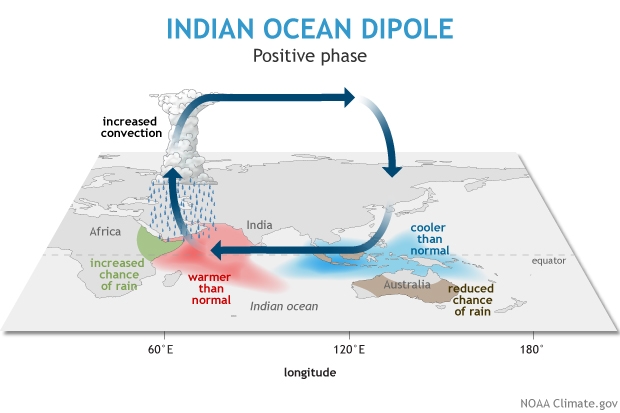
Many climate events were influenced by the strong positive Indian Ocean dipole, which, in October, reached its greatest magnitude since 1997.
- The precipitation patterns resulting from the event, as described in the Global Oceans section above, contributed to a large rainfall deficit from the eastern Indian Ocean to the South Pacific Ocean east of Australia.
- This strong positive Indian Ocean dipole was unique in that it was not associated with concurrent strong El Niño conditions, as is typical.
State of the Climate – The Arctic
The Arctic land surface tempera- ture for 2019 was the second highest in the 120-year record, following 2016, with record high temperatures in Alaska and north- west Canada.
Mean annual Arctic surface air temperatures over land have increased more than twice as fast as the global mean since the mid-1980s.
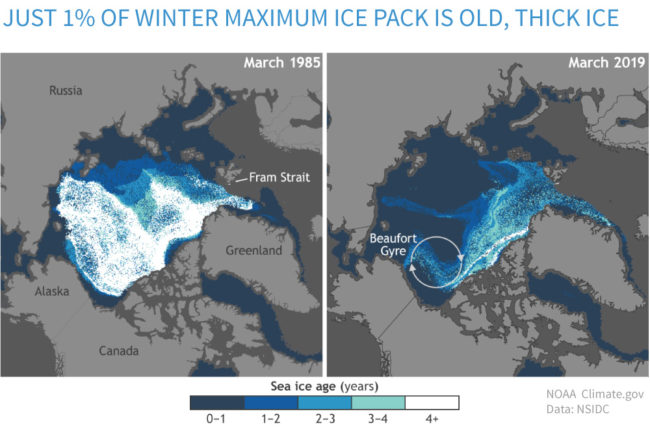
In March 2019, when Arctic sea ice reached its maxi- mum extent for the year, thin, first-year ice predominated at ~77% of the footprint’s area, compared to about 55% in the 1980s. Winter sea ice coverage in the Bering Sea was by far the lowest since at least 1850, the second year in row to break the record low. In September, the minimum sea ice extent at the end of summer tied with 2007 and 2016 for the second smallest in the 41-year satellite record.
During the 2019 melt season, the extent and magni- tude of ice loss over the Greenland ice sheet rivaled 2012, the previous year of record ice loss. Glaciers and ice caps across the Arctic also continued a trend of significant ice loss throughout the Arctic, especially in Alaska and Arctic Canada.
In the atmosphere above Antarctica, tropospheric waves that propagated upward in late August resulted in record-setting stratospheric tempera- tures as high as 16°C above average at 50 hPa in early September. This sudden stratospheric warming event strongly affected climate trends for the remainder of the year.
Regional
North America
Mexico reported its second warmest year in its 48-year record, and Alaska reported its warmest in its 95-year record.
The contiguous United States observed its second wettest year on record, behind 1973. Canada experienced a catastrophic spring flood along the Ottawa and St. Lawrence Rivers. This was even larger than an event that occurred in 2017, considered at the time to be the flood of the century.
For a third consecutive year, drought conditions worsened in southern Mexico due to the absence of tropical cyclones near this region.
Central America and the Caribbean
The Caribbean region observed its warmest year since records began in 1891.
Tropical Storm Karen caused flooding and storm surges in parts of the southeastern and northeastern Caribbean, impacting Trinidad and Tobago, Dominica, Puerto Rico, and other islands. The storm impacted Puerto Rico the day after the island experienced a 6.0 earthquake on the Richter scale.
South America
South America as a whole observed its second-warmest year on record, behind only 2015. The last five years were the five warmest years in the continental 110-year record.
In south-central Chile, rainfall deficits in 2019 added to a prolonged drought that began there in 2010. The cities of Valparaiso and Curicó (Chile) and Bahía Blanca (Argentina) had their driest year on record since 1961.
Africa
The year 2019 was the warmest year on record for South Africa (tied with 2015) as well as for several western Indian Ocean islands, including Mauritius, Mayotte, Comoros, Seychelles, and Réunion Island.
A strong positive Indian Ocean dipole contributed to excess rainfall in the Horn of Africa from October through December that resulted in widespread flooding across East Africa. Mombasa (Kenya) and Kinshasa and Pt. Noire (Republic of Congo) received more than five times their normal October rainfall.
Europe
The year 2019 was among its four warmest years on record for Europe, with all four of the warmest years occurring since 2014. Record warmth was reported for Estonia (tied with 2015), Serbia, Belarus, Romania, Ukraine, Moldova, Poland, Latvia, Lithuania, and Hungary.
Two major heat waves occurred in June and July across central and western Europe. On July 25, a new German national daily high temperature record of 42.6°C was set at Lingen. New national all-time daily record temperatures were also set in the Netherlands and Belgium, as daily temperatures surpassed 40°C in those countries.
Asia
2019 was the warmest year on record for Japan, Hong Kong, and Singapore (tied with 2016). On April 20, the temperature in Huong Khe (Ha Tinh), Vietnam, reached 43.4°C, a new national high temperature record. On July 17, Tehran, Iran, set a new record high minimum (nighttime) temperature of 33.8°C.
Indonesia was marked by severe drought during the year. In one of the most affected areas, no rain fell in the East Sumba District of the East Nusa Tenggara Province for 263 days.
Five tropical cyclones made landfall in China. Tropical Cyclone Lekima was the fifth-strongest storm to make landfall since 1949 and caused approximately $8.5 billion (U.S. dollars) in direct economic losses. Seven typhoons affected South Korea, tying with 1950 and 1959 for the most on record.
Oceania
The year was record hot in Australia, with warmth persistent through the year. January was Australia’s warmest month among all months in the 110-year record. The country observed its all-time hottest day on December 18, when the national maximum temperature reached 107.38°F (41.88°C), easily exceeding the previous record by 2.84°F (1.58°C).