

A new study by researchers has been published within AGU’s journal Geophysical Research Letters that highlights a warming trend within the deep ocean.
Let’s take a look.
Study: Observed Ocean Bottom Temperature Variability at Four Sites in the Northwestern Argentine Basin: Evidence of Decadal Deep/Abyssal Warming Amidst Hourly to Interannual Variability During 2009–2019
Published as open access paper on Sep 9, 2020 (until Nov 13). It opens a window into what is going on within the deep ocean.
If we truly wish to understand what is happening on a global scale, then we need to not only consider land based and ocean surface measurements, we also need to consider measurements from the deep ocean.
What exactly does this paper do?
It presents several decade‐long records of hourly temperature measurements from moored sensors 1 m above the seafloor in the northwestern Argentine Basin within the western South Atlantic Ocean. These sites, which range in depth from 1,360 to 4,757 m, show energetic temperature variations on daily to interannual time scales.
What does it reveal?
The intensity of these variations is higher at the two shallower sites than is observed at the two deeper sites. In addition to the daily to interannual variations, long‐term warming trends are also detected over the period 2009–2019 at all four sites. The study also uses the hourly records at the two deeper sites to estimate how frequently the temperature at these locations must be observed in order to estimate the long‐term trends accurately.
Details and Author comments
What follows below is taken from materials that AGU released. It was composed by science writer Rachel Fritts on October 13, 2020
All sites exhibited a warming trend of 0.02 to 0.04 degrees Celsius per decade between 2009 and 2019 – a significant warming trend in the deep sea where temperature fluctuations are typically measured in thousandths of a degree. According to the study authors, this increase is consistent with warming trends in the shallow ocean associated with anthropogenic climate change, but more research is needed to understand what is driving rising temperatures in the deep ocean.
“In years past, everybody used to assume the deep ocean was quiescent. There was no motion. There were no changes, But each time we go look we find that the ocean is more complex than we thought.”
Chris Meinen, an oceanographer at the NOAA Atlantic Oceanographic and Meteorological Laboratory and lead author of the new study.
The challenge of measuring the deep
Researchers today are monitoring the top 2,000 meters (6,560 feet) of the ocean more closely than ever before, in large part due to an international program called the Global Ocean Observing System. Devices called Argo floats that sink and rise in the upper ocean, bobbing along in ocean currents, provide a rich trove of continuous data on temperature and salinity.
The deep sea, however, is notoriously difficult to access and expensive to study. Scientists typically take its temperature using ships that lower an instrument to the seafloor just once every ten years. This means scientists’ understanding of the day-to-day changes in the bottom half of the ocean lag far behind their knowledge of the surface.
Meinen is part of a team at NOAA carrying out a rare long-term study at the bottom of the ocean, but until recently, the team thought the four devices they had moored at the bottom of the Argentine Basin were just collecting information on ocean currents. Then Meinen saw a study by the University of Rhode Island showcasing a feature of the device he had been completely unaware of. A temperature sensor was built into the instrument’s pressure sensor used to study currents and had been incidentally collecting temperature data for the entirety of their study. All they had to do was analyze the data they already had.
“So we went back and we calibrated all of our hourly data from these instruments and put together what is essentially a continuous 10-year-long hourly record of temperature one meter off the seafloor,” Meinen said.
Dynamic depths
The researchers found at the two shallower depths of 1,360 and 3,535 meters (4,460 feet and 11,600 feet), temperatures fluctuated roughly monthly by up to a degree Celsius. At depths below 4,500 meters (14,760 feet), temperature fluctuations were more minute, but changes followed an annual pattern, indicating seasons still have a measurable impact far below the ocean surface. The average temperature at all four locations went up over the course of the decade, but the increase of about 0.02 degrees Celsius per decade was only statistically significant at depths of over 4,500 meters.
According to the authors, these results demonstrate that scientists need to take the temperature of the deep ocean at least once a year to account for these fluctuations and pick up on meaningful long-term trends. In the meantime, others around the world who have used the same moorings to study deep sea ocean currents could analyze their own data and compare the temperature trends of other ocean basins.
“There are a number of studies around the globe where this kind of data has been collected, but it’s never been looked at, I’m hoping that this is going to lead to a reanalysis of a number of these historical datasets to try and see what we can say about deep ocean temperature variability.”
Chris Meinen
A better understanding of temperature in the deep sea could have implications that reach beyond the ocean. Because the world’s oceans absorb so much of the world’s heat, learning about the ocean’s temperature trends can help researchers better understand temperature fluctuations in the atmosphere as well.
“We’re trying to build a better Global Ocean Observing System so that in the future, we’re able to do better weather predictions, At the moment we can’t give really accurate seasonal forecasts, but hopefully as we get better predictive capabilities, we’ll be able to say to farmers in the Midwest that it’s going to be a wet spring and you may want to plant your crops accordingly.”
Chris Meinen
Illustrations
The following illustration is from the paper itself.
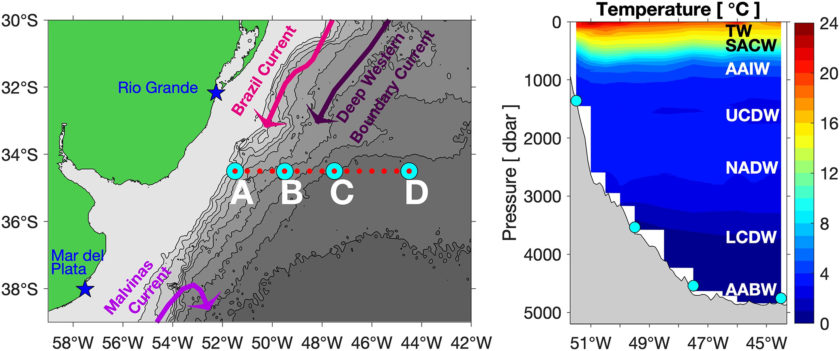
(left) Map indicating the locations of the four Pressure Inverted Echo Sounder (PIES) moorings (large cyan circles) and the nominal locations of the conductivity‐temperature‐depth (CTD) profiles collected on routine research cruises (red dots). PIES site names are denoted by large white letters. Bottom topography from the Smith and Sandwell (1997) data set is shown as gray‐filled contours with a 500 m contour interval. Simple schematic arrows indicating the locations of the nearby major ocean currents are included to illustrate the array position relative to the large‐scale flow features; schematic modified from Valla et al. (2018).
(right) Vertical section of temperature (averaged from four CTD sections during 2009–2012) along the PIES mooring line. PIES locations are shown as cyan circles. Nominal central depths of key water mass layers denoted by acronyms following Valla et al. (2018). –
- TW = Tropical Water;
- SACW = South Atlantic Central Water;
- AAIW = Antarctic Intermediate Water;
- UCDW = Upper Circumpolar Deep Water;
- NADW = North Atlantic Deep Water;
- LCDW = Lower Circumpolar Deep Water;
- AABW = Antarctic Bottom Water.