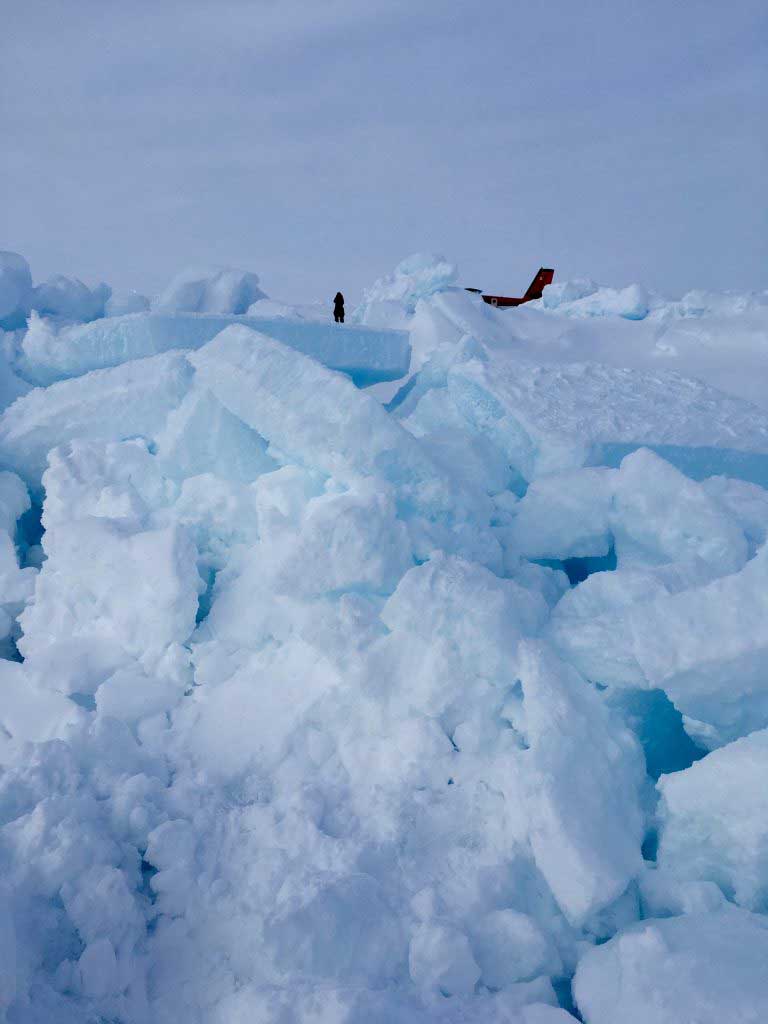
Credit: J. Stroeve/NSIDC
NSIDC have published their April update, and that of course prompts a question. Has it been a normal average dull April with nothing of note, or do we have a new low?
Arctic sea ice extent for April 2017 tied with April 2016 for the lowest in the satellite record for the month. Warm weather conditions and lower-than-average sea ice extent prevailed over the Pacific side of the Arctic, while relatively cool conditions were the rule in northern Europe and eastern North America. In the Southern Hemisphere, Antarctic sea ice extent remained lower than average.
… and to be a tad more specific about the #Arctic sea ice numbers …
Arctic sea ice extent for April 2017 averaged 13.83 million square kilometers (5.34 million square miles), and tied with April 2016 for the lowest April extent in the 38-year satellite record. The April 2017 extent is 1.02 million square kilometers (394,000 square miles) below the April 1981 to 2010 long-term average.
This past April was a month that was very similar to the seasonal decline observed in the previous two years. As the month proceeded, we were at record lows for the entire period of satellite observations or at least within 100,000 square kilometers of that.
Young Sea Ice
Part of the overall saga here is not simply a decline in the extent, but also a decline in the quantity of old sea ice. Below is a chart that illustrates how the quantity of ice that survives the summer melt and makes it into the next year has been rapidly shrinking …
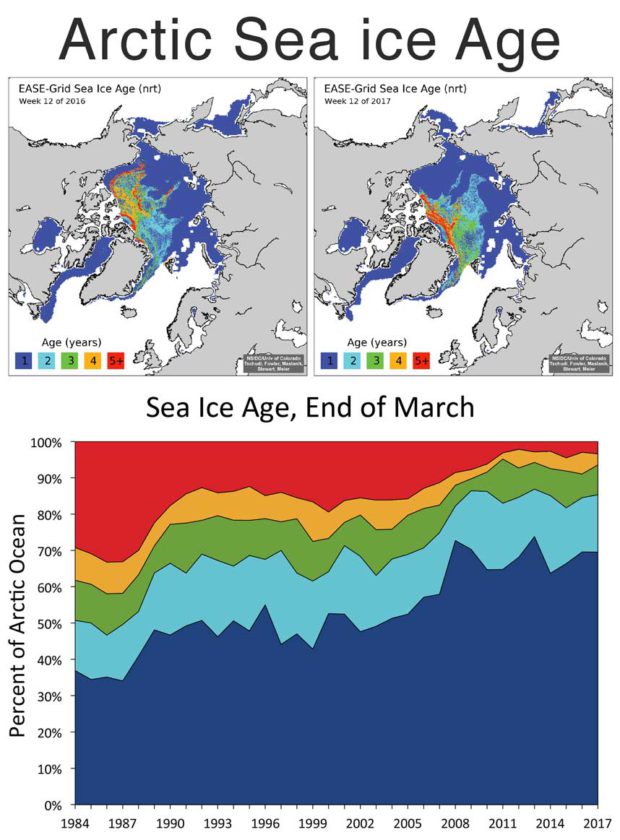
What the above shows you is as follows. The top left illustrates where old sea ice was at the end of March 2016. Top right is one year later at the end of March 2017. The graph under both of these illustrates how the older sea ice has been declining over time.
What is shocking here is that in the mid 1980s as much as one third of Arctic sea ice was five years or older, and now that is only about 5%. The location of the old sea ice is also changing. In contrast to the previous year it is now all squashed up against Greenland.
The transition of the arctic to a new state continues and we observe that the overall warming trend is ongoing.
Twitter Reactions
As usual, the subject matter experts have a few nice graphs that illustrate the overall trend and big picture here.
Latest #Arctic sea ice volume data (from PIOMAS) indicates yet another record low month (April, sat era). 1800 km^3 below previous record pic.twitter.com/5V369plekm
— Zack Labe (@ZLabe) May 3, 2017
April #Arctic sea ice thickness & volume were the lowest on record in PIOMAS (satellite era)
For data & more info: https://t.co/UDsruDEI5p pic.twitter.com/dUXjdJWf5u
— Zack Labe (@ZLabe) May 3, 2017
Latest Update on #Arctic Sea-Ice Extent, Temperatures, etc. We are in uncharted waters.https://t.co/vygEsBYFtd#climate #climatechange pic.twitter.com/hKaocwma9F
— Paul Beckwith (@PaulHBeckwith) May 3, 2017
#Arctic sea ice extent for April 2017 tied with April 2016 for the lowest in the satellite record for the month. https://t.co/fADvcG2Q4l pic.twitter.com/iSioj2zs48
— National Snow and Ice Data Center (@NSIDC) May 3, 2017
Preliminary surface temperatures over the #Arctic (>66°N, R1) are the 2nd warmest on record from 1948 (January-April) pic.twitter.com/IszstC1oJk
— Zack Labe (@ZLabe) May 3, 2017
Since 2011, old ice has made up <5% of total ice cover in the #Arctic. In the mid-80s, old ice made 1/3 of the ice. https://t.co/fADvcFLeFL pic.twitter.com/DLOA9iOcOX
— National Snow and Ice Data Center (@NSIDC) May 3, 2017
Further Reading
- CRYOVEX: FIRST RESULTS SHOW SEA ICE CONTINUES TO THIN – Posted 1st May