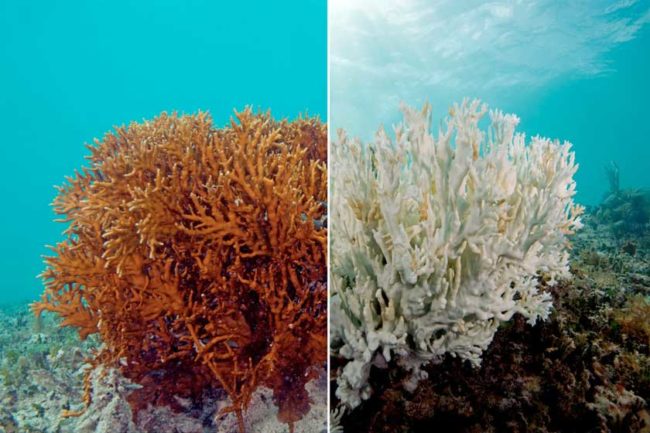
Back last April I was posting about the vast Coral Reef Bleaching event that had been recorded on the Great Barrier Reef …
The largest coral structure in the world, the Great Barrier Reef which is roughly about 1,400 miles long, is experiencing yet another major bleaching event.
Recent major bleaching events have happened in 1998, a dramatic El Nino year, 2002, and also last year in 2016. Since 2016 was also an El Nino year, there was a suggestion by some that it was due to El Nino and not climate change.
2017 has also now witnessed another major bleaching event and so this is happening in a non El Nino year and also in a consecutive year. The root cause is clearly climate change.
Terry Hughes, the Director of ARC Centre of excellence @CoralCoE and a highly cited Subject Matter expert, has written a paper along with several well-respected co-authors in which they highlight just how drastically things are changing.
Patterns of mass bleaching of corals
The paper itself can be found here on Science.
What exactly is the paper all about?
We analyzed bleaching records at 100 globally distributed reef locations from 1980 to 2016.
What did they discovery from that analysis?
There are three key messages here …
The median return time between pairs of severe bleaching events has diminished steadily since 1980 and is now only 6 years.
As global warming has progressed, tropical sea surface temperatures are warmer now during current La Niña conditions than they were during El Niño events three decades ago.
as we transition to the Anthropocene, coral bleaching is occurring more frequently in all El Niño–Southern Oscillation phases, increasing the likelihood of annual bleaching in the coming decades.
Diagrams
Yes, it’s a science paper, and yes there are lots of words that do actually articulate the evidence in detail. Sometimes however a graph is a more powerful communications tool for getting the message across. A classical example of this is perhaps the now famous hockey stick diagram. With that thought in mind, here is one rather important diagram extracted from that paper.
Where has the Coral Bleaching been happening?
So the key point is this – Bleaching before the 1980s was recorded only at a local scale of a few tens of kilometers. This is because the cause was usually something very localised such as such as freshwater inundation, sedimentation, or unusually cold or hot weather.
Coral Reef bleaching events are happening on a global scale …
 Within the above each coloured dot marks the location of a coral reef. These are the 100 reef locations that paper looked at
- Red = severe bleaching affecting >30% of corals
- Orange = moderate bleaching affecting <30% of corals
- Blue = no substantial bleaching recorded
To translate that for you – 75% of the 100 reefs they examined have been severely impacted by bleaching events.
This is a rather stark Warning
We are fast approaching a time when every summer, with or without an El Nino, will bring about Coral bleaching events. We are already seeing an increased rate for such events, and this is so much so that there is no longer enough time for the Corals to recover.
“The climate has warmed rapidly in the past 50 years, first making El Niños dangerous for corals, and now we’re seeing the emergence of bleaching in every hot summer.”
Coral Reefs are playing the role of a Sentinel species for humanity. This proverbial canary in the coal mine is gasping for breath and keeling over.
Are enough of us listening and paying attention?
Hint: Doing nothing about Climate Change is not an option.