

How do we know that humans are responsible for Global warming, or that there is in fact any Global warming at all, what evidence do we have?
There are in fact several lines of evidence.
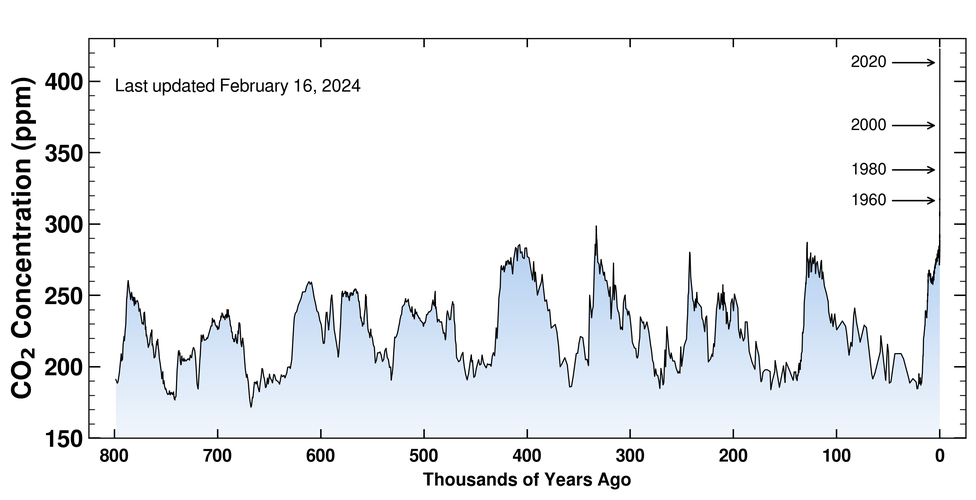
- We know that certain gases such as CO2 are greenhouse gases. This is been an established fact for rather a long time. We also have a precise measurement of the amount of CO2 within our atmosphere that goes back 800,000 years (ice core data), and that reveals a huge spike where it becomes wholly clear that we have greatly increased it.
- We have measurements that reveal that global temperatures are increasing.
- We have measurements that revel that sea level is not only rising, but that the rate of that rise is accelerating.
- We have measurements that show us the rates at which ice is melting at the poles.
Is that it?
There is a new study that has just been published within Science that now adds to the above. It uses satellite data and the anthropogenic “fingerprint” predicted by climate models to show the extent of the effects. It also discusses how these changes have been caused. (Spoiler alert: it’s us).
Science: Human influence on the seasonal cycle of tropospheric temperature
Published yesterday in Science on 20th July, it uses use pattern information to separate human and natural influences on climate.
They asked themselves if human influences are identifiable in the changing seasonal cycle and so they focused on satellite measurements of Earth’s troposphere (That’s the bit that extends from the surface to roughly 16 km at the tropics and 13 km at the poles). Using data gathered on a global scale they looked at the seasonal changes and how they changed over time.
Why would they do it, why specifically pick this?
There is existing evidence that we are impacting the seasonal variations. There are very clear changes in the distributions and abundances of plant and animal species, and we also know that we do impact the troposphere in very measurable ways (ozone depletion, particulate pollution, etc..).
The biological signals are telling us that seasonal climate changes because of global warming are happening, hence a study such as this is wholly warranted.
What did they find?
The amplitude of the annual seasons cycle within the mid-latitudes had rather prominent increases. Their results suggest that attribution studies with the seasonal cycle of tropospheric temperature provide powerful and novel evidence for a statistically significant human effect on Earth’s climate.
To get a tad more technical and specific …
The simulated response of the seasonal cycle to historical changes in human and natural factors has prominent mid-latitude increases in the amplitude of TAC. These features arise from larger mid-latitude warming in the summer hemisphere, which appears to be partly attributable to continental drying. Because of land-ocean differences in heat capacity and hemispheric asymmetry in land fraction, mid-latitude increases in TAC are greater in the Northern Hemisphere than in the Southern Hemisphere. Qualitatively similar large-scale patterns of annual cycle change occur in satellite tropospheric temperature data.
We applied a standard fingerprint method to determine (i) whether the pattern similarity between the model “human influence” fingerprint and satellite temperature data increases with time, and (ii) whether such an increase is significant relative to random changes in similarity between the fingerprint and patterns of natural internal variability. This method yields signal-to-noise (S/N) ratios as a function of increasing satellite record length. Fingerprint detection occurs when S/N exceeds and remains above the 1% significance threshold.
We find that the model fingerprint of externally forced seasonal cycle changes is identifiable with high statistical confidence in five out of six satellite temperature datasets. In these five datasets, S/N ratios for the 38-year satellite record vary from 2.7 to 5.8. Our positive fingerprint detection results are unaffected by the removal of all global mean information and by the exclusion of sea ice regions. On time scales for which meaningful tests are possible (one to two decades), there is no evidence that S/N ratios are spuriously inflated by a systematic model underestimate of the amplitude of observed tropospheric temperature variability.
Summary
They have provided scientific evidence that a human-caused signal in the seasonal cycle of tropospheric temperature has emerged from the background noise of natural variability.
Satellite data and the anthropogenic “fingerprint” predicted by climate models show common large-scale changes in geographical patterns of seasonal cycle amplitude. These common features include increases in amplitude at mid-latitudes in both hemispheres, amplitude decreases at high latitudes in the Southern Hemisphere, and small changes in the tropics. Simple physical mechanisms explain these features.
Attribution studies with the changing seasonal cycle provide powerful evidence for a significant human effect on Earth’s climate.
Via Carbon Brief …
The map below shows how the difference between summer and winter temperatures, expressed as an average per decade, has changed across the world.
On the map, dark red indicates where the difference between summer and winter temperatures have grown larger, while dark blue shows where the difference has grown smaller.

The map shows that the difference between summer and winter temperatures has increased the most in mid-latitude regions, particularly in the northern hemisphere.
This is because, in these regions, atmospheric summer temperatures are increasing at a faster rate than winter temperatures – causing the disparity between the two seasons to grow larger and larger, the researchers say.
The northern hemisphere has experienced more summertime warming than the southern hemisphere because it contains more land, the researchers say. The presence of land means that less heat can be absorbed by the ocean – leading to amplified atmospheric warming.
Further Reading
Carbon Brief: ‘Powerful evidence’ of global warming’s effect on seasons found in troposphere …
One possible effect could be changes to the timing and likelihood of extreme weather events, says Prof Neil Harris, head of the Centre for Environment and Agricultural Informatics at Cranfield University, who was not involved in the research. He tells Carbon Brief:
“The paper significantly increases confidence that the observed changes in the troposphere – where all our weather is – are consistent with models and that they are of human origin. This gives more confidence in the existing findings of an increase frequency of extreme weather, such as more intense rainfall and more extreme summer hot spells.”